When I was reading about the universe’s age the other night, I stumbled onto a Wikipedia page about the “observable universe,” and it honestly blew my mind. It’s one of those things that sounds like science fiction, the idea that there’s a hard limit to what we can see, and it’s way further away than you’d think.
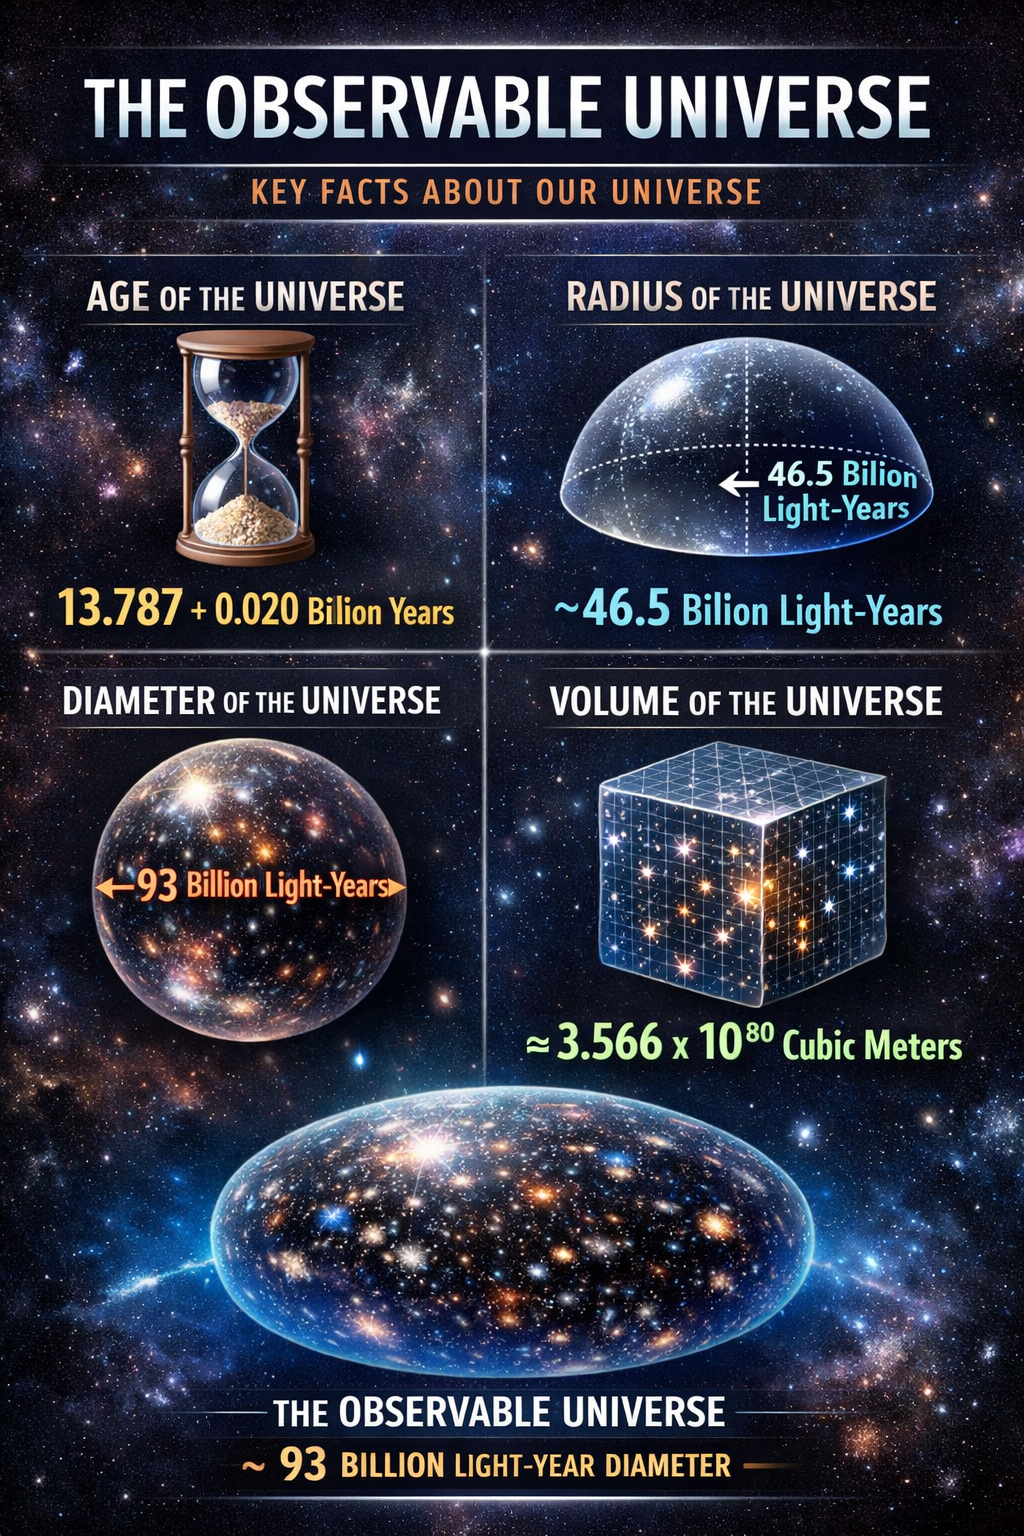
If the universe is roughly 13.8 billion years old, you’d assume the furthest thing we can see is 13.8 billion light-years away. But the actual number is about 46.5 billion light-years in every direction. That makes the whole observable universe a giant sphere about 93 billion light-years across. Here is what I discovered about the boundaries of our cosmic neighborhood.
Observable Edge
The observable edge, or cosmic horizon, can be thought of as a time-delay boundary rather than a physical wall. It represents the furthest limit from which light has had enough time to travel and reach our eyes since the Big Bang. Everything within this boundary forms a perfect sphere with us at the center. This isn’t because we are in the middle of the universe, but because we are the center of our own perspective. The scale of this sphere is difficult to visualize, but the data gives us a framework for just how much “room” we have to explore.
So, how is the radius 46.5 billion light-years if the light has only been traveling for 13.8 billion years? While light travels toward us, the space through which it travels is actually expanding. It’s like a runner trying to finish a marathon while the road itself is being stretched behind and in front of them. The light eventually reaches us, but the source of that light has since moved much further away.
Why the math doesn’t seem to add up
The reason the edge is so much further away than the age of the universe is because of the way space stretches. A lot of people use the “expanding balloon” analogy to explain this, and it’s probably the best way to visualize it.
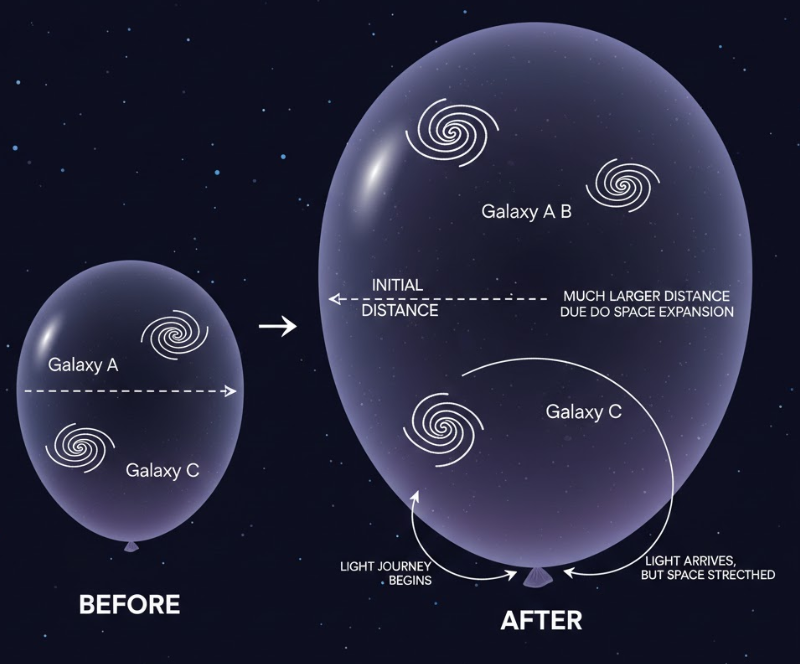
Imagine you have a balloon that hasn’t been blown up yet. You draw two dots on it with a Sharpie to represent galaxies. If you start blowing air into that balloon, the rubber stretches and the dots move away from each other. Now, imagine a tiny ant crawling from one dot to the other. While the ant is walking, the balloon is growing. By the time the ant reaches the second dot, the actual distance it covered is much longer than the distance between the dots when it first started its journey.
In this scenario, light is the ant. While light is traveling toward us, the space through which it’s traveling is expanding. So, by the time the light from a distant galaxy finally hits our telescopes, that galaxy has been pushed much further away than it was when it first emitted that light.
The trippy part is that because this expansion is actually speeding up, there are parts of the universe that are basically “dropping off” our map. These regions are moving away from us faster than the speed of light. That doesn’t mean the galaxies themselves are breaking physics; it just means the space between us is growing so fast that light can never bridge the gap. It’s like trying to run up a down-escalator that’s moving way faster than you can sprint. You’ll just never reach the top.
The first snapshot of the universe
If we look as far back as possible, to the very edge of that 46.5 billion light-year radius, we find the Cosmic Microwave Background (CMB). This is essentially the afterglow of the Big Bang.
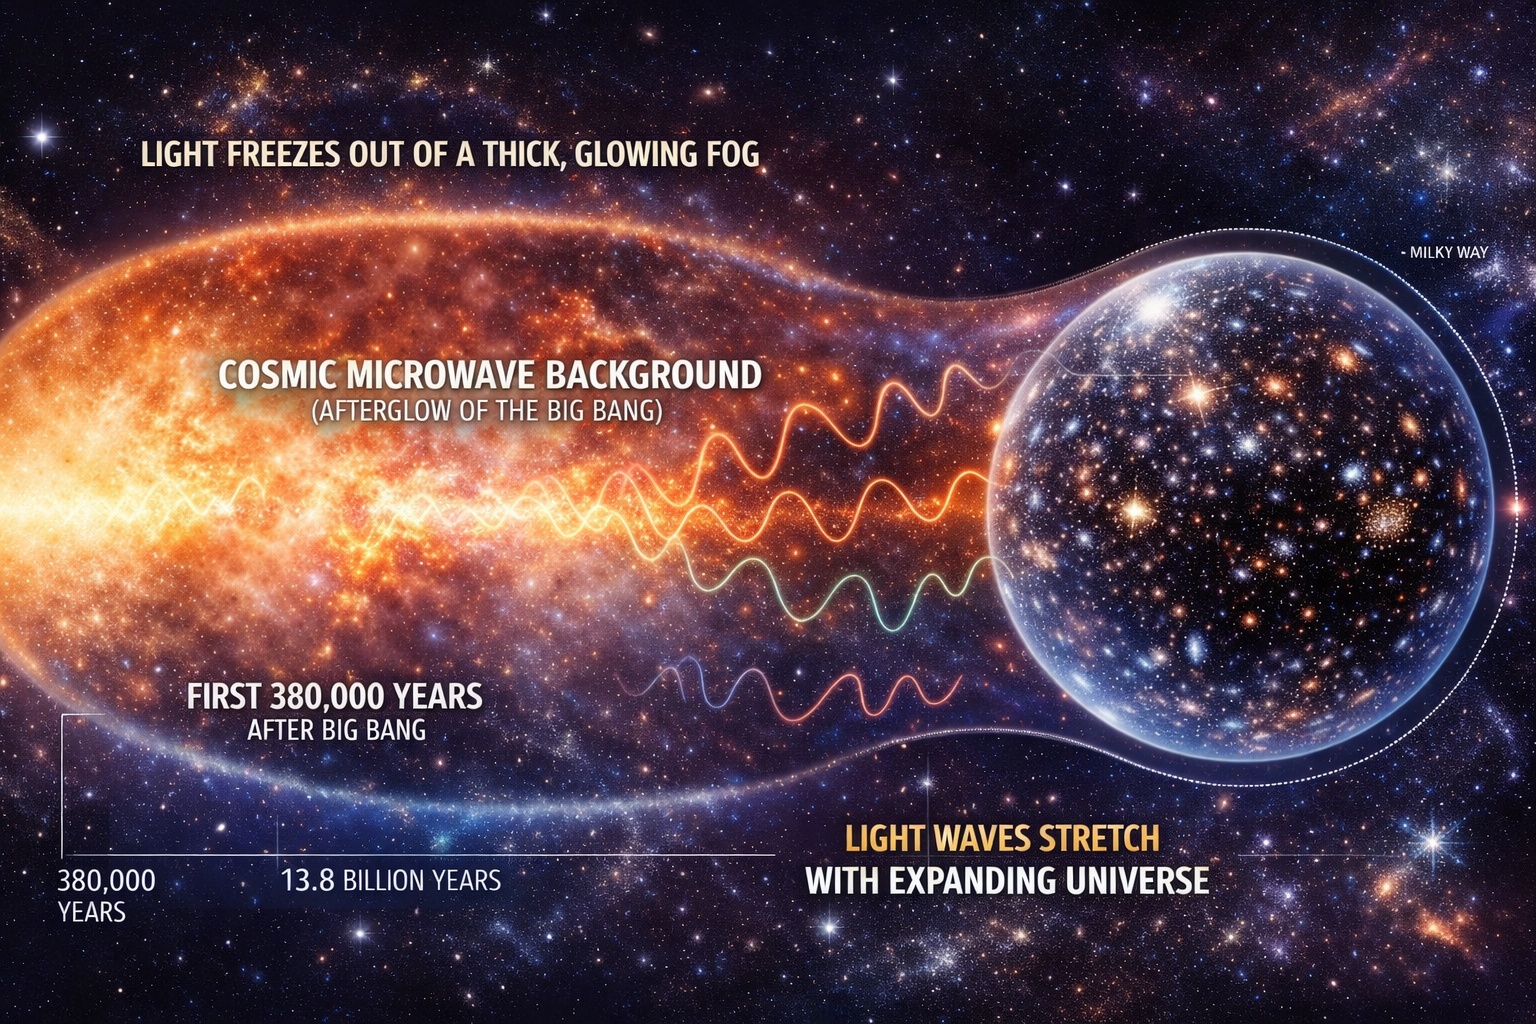
For the first 380,000 years, the universe was so hot and crowded that light couldn’t even move; it was like a thick, glowing fog. Eventually, things cooled down enough for light to break free, and that light has been traveling through space for billions of years. Because the universe has stretched so much since then (an expanding balloon analogy), those light waves have been stretched until they became microwaves.
New problems in 2025
Scientists are actually in a bit of a crisis over this right now. As of early 2025, data from the James Webb Space Telescope and recent studies from the Atacama Cosmology Telescope have confirmed something called the “Hubble Tension.”
Basically, when we look at the CMB to see how fast the universe should be expanding, we get one answer. But when we look at actual stars and galaxies today, they seem to be moving much faster than the early data predicted. Research published throughout 2024 and into 2025 suggests we might need “New Physics” to explain the gap, maybe a weird version of dark energy that only existed for a little while right after the universe began.
It’s a bit humbling to realize that even with our best tech, we’re essentially sitting inside a bubble, looking at a “baby picture” of the cosmos that we’re still trying to fully understand.
Where does this leave us?
Realizing that our maps of the universe are still being redrawn is actually pretty exciting. We often think of science as a finished book, but the “Hubble Tension” reminds us that we’re still very much in the middle of the story. The fact that the universe we see today doesn’t quite match the “baby picture” from the CMB doesn’t mean we’re wrong, it just means there’s something massive and invisible still waiting to be discovered.
At the end of the day, the 46.5 billion light-year edge isn’t a wall, it’s just the limit of our current perspective. We are small observers in a vast, stretching fabric, trying to decode a message that has been traveling for billions of years. It’s a reminder that no matter how much we think we’ve figured out, the cosmos still has plenty of ways to surprise us. Whether the answer lies in new physics or a deeper understanding of dark energy, the search itself is what keeps us looking up.