
Ajitabh Pandey's Soul & Syntax

Exploring systems, souls, and stories – one post at a time

Category: Resilience

  • Anatomy of a One-Minute Outage
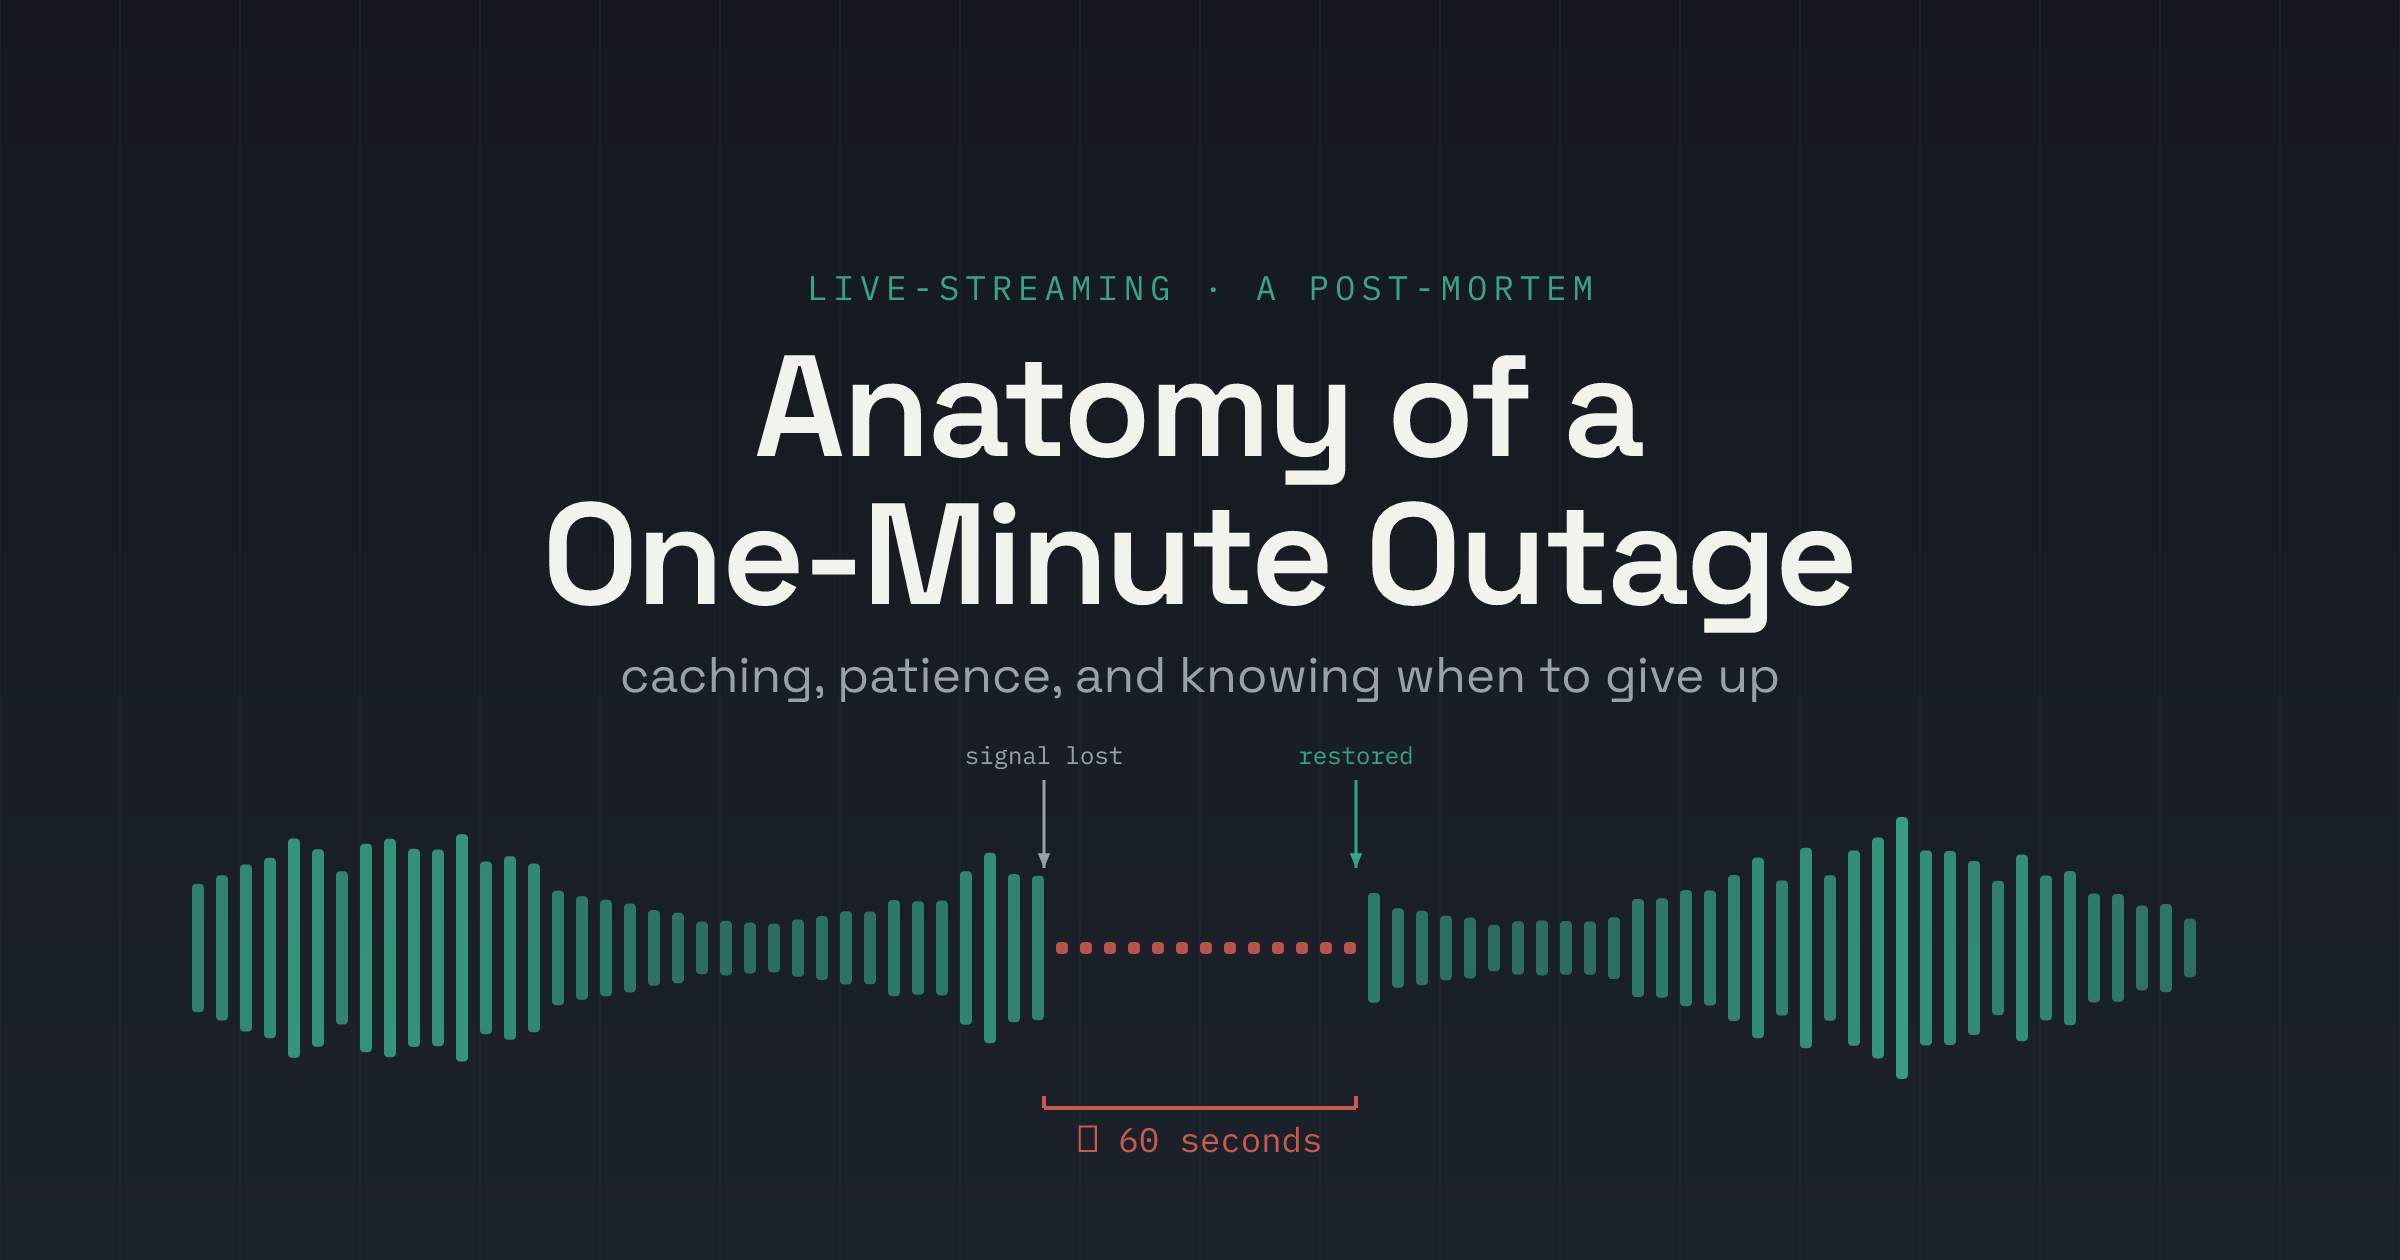
    Anatomy of a One-Minute Outage

    “Some people are saying the audio is broken and the video looks degraded. But it works absolutely fine everywhere I’ve checked.”

    If you’ve ever run a live service — streaming or otherwise — you know this exact message. It arrives during your most important hour. You check. It works. You check from your phone. It works. And yet the complaints keep coming.

    In my over 30 years of operational support, this is the most dangerous kind of problem because the instinct is to dismiss it. I have seen it numerous times that the term “It works for me” is the graveyard of unresolved incidents. As one of the YouTubers I follow says, the truth lies somewhere in between. Both parties are right: the stream was working, and it was broken — for different people, at the same time, for a reason that only made sense once I looked at the whole system.

    I run the streaming for our live Satsang (a community worship gathering focused on Arti and prayers) transmissions. This is broadcast to thousands of listeners twice a day. The audience is unusually sensitive to interruptions; a thirty-second silence during a transmission is not a minor bug; it’s a broken experience for people in a moment of devotion.

    The architecture is common and unremarkable: an encoder at the venue sends the feed to an origin server, which transcodes it into multiple qualities, and a set of distribution servers deliver small chunks of audio and video — called segments — to every listener’s phone.

    Architecture diagram showing an encoder at the venue sending one feed to an origin server, which transcodes it into multiple qualities, passed to five distribution servers that deliver .ts and .m3u8 segments to listeners' phones.
    The shape of the system: one feed in at the venue, transcoded into several qualities at the origin, then delivered as small segments by a set of distribution servers to every listener’s phone.

    This blog post is the story of this simple word, “segments”.

    Reading the graphs like a detective

    When the complaints came in, I pulled up three dashboards: the load balancer, the distribution servers, and the transcoding origin. For the non-technical reader, think of it as checking three witnesses to the same event.

    The load balancer said: traffic is climbing steadily, capacity is fine, but a small percentage of requests are failing — and that percentage is growing with the audience. Nothing was overloaded. That ruled out the easy answer (“too many viewers/listeners”).

    The distribution servers said something far more interesting. At exactly 14:46, all five of them — simultaneously — logged a sharp spike of “file not found” errors. Not for the audio chunks. For the playlists: the small index files that tell every player which chunks to fetch next. Then the errors vanished. The whole event lasted about one minute.

    Five independent servers erroring at the same instant means the problem wasn’t on any of them. They were all faithfully reporting the same upstream truth: for one minute, the playlists disappeared at the source.

    Diagram of a streaming pipeline from encoder to origin to five distribution nodes to listeners; a network blip hits the first link but 404 errors appear across all five distribution nodes, showing the cause is upstream.
    Reading witnesses. Five independent servers erroring at the same instant don’t share a fault — they’re reporting a single upstream truth. The arrow points back to the origin.

    I confirmed it: the venue’s internet connection had blipped. The encoder disconnected, reconnected, and streaming resumed. Sixty seconds, start to finish. So here is the puzzle that makes this worth writing down: why did a one-minute network blip cause a much longer complaint of “broken audio”  from some listeners, while everyone else — including me — saw nothing wrong?

    The optimization that turned against me

    Months earlier, I had made a genuinely good change. Streaming works by having every player download a new chunk every few seconds. Each chunk, once created, never changes — so I told every player and every cache in between: this file is immutable; cache it for a year, never ask again. Request volume dropped, the experience got smoother, everything stabilized. And I was happy and proud.

    That optimization had one hidden assumption, and the one-minute blip violated it. When the transcoder restarted after the reconnect, it began numbering its output chunks from zero again: index_0.ts, index_1.ts, index_2.tsthe same filenames it had used hours earlier, now containing completely different audio. But listeners’ phones, and caches along the way, still held the old files under those names, with my own instruction stamped on them: immutable, trust this for a year.

    Diagram showing two listeners requesting the same filename index_3.ts. The fresh listener fetches the new chunk and gets clean audio; the cached listener is served an old chunk from hours earlier and gets garbled audio.
    The invisible difference. Identical requests receive different bytes because the two devices remember different things. Hidden state — not a server fault — is why “broken” and “fine” were reported at the same moment.

    So a listener’s player would fetch index_3.ts, be handed a stale chunk from hours ago straight out of cache, and produce garbled audio. A fresh listener — or me, checking whether “it works” — had no cached history, fetched everything anew, and heard a perfect stream. Both witnesses were telling the truth.

    There was a second, quieter failure stacked on top. Live playlists carry a running counter so players can track their position. When the transcoder restarted from zero, that counter jumped backward. Players interpret time moving backward as corruption and stall or bail out. Fresh players never saw the jump.

    The lesson, for anyone leading a team: an optimization is a bet on an assumption. “Cache forever” bet that filenames are never reused — it paid off daily for months, then an unrelated event silently broke the assumption. When a stable system misbehaves after an incident, don’t ask “what broke?” Ask which assumption did the incident violate?

    The fix: make names impossible to reuse

    The elegant repair wasn’t to remove caching. Caching was doing real good. It was to make the assumption true forever. I changed the transcoder to start its chunk numbering from the current clock time when it launches. The arithmetic makes reuse impossible: chunk numbers advance by one every twelve seconds, but the clock advances by twelve in the same span. Any restart begins at a number far ahead of anything the previous run could reach. No two chunks, across any sequence of crashes, can ever share a name. As a bonus, the position counter now jumps forward on restart instead of backward. When this happens, the players handle a forward jump gracefully, snapping to the live edge instead of breaking.

    I also reduced the cache duration from “one year” to 60 seconds. Why did I choose this 60-second number? The reason is that a chunk is only referenced by the playlist for about four minutes before it scrolls out and is deleted. Caching beyond that window buys nobody anything; it only extends how long a stale file can haunt you.

    The lesson for engineers: set cache lifetimes based on the data’s lifecycle, not on optimism. “How long is this file legitimately needed?” has an actual answer. Use it.

    Dissecting the sixty seconds

    With the corruption fixed, I turned to the outage itself. Why did a network blip cost a full minute? I decomposed it, and every second had an owner.

    The origin took thirty seconds just to notice the encoder was gone. A silently dropped connection doesn’t announce itself; the server waits until the configured silence threshold is reached before declaring the publisher dead. Until then, it holds the old “zombie” session. And this is where it is cruel: it rejects the encoder’s own reconnection attempts, because as far as it knows, that stream name is still occupied. Then a couple of seconds to reconnect once the zombie cleared, a moment to spin up, twelve seconds to produce the first new chunk, and then a second or two to sync out.

    Two stacked timelines. The old configuration takes about sixty seconds, dominated by a thirty-second detection phase; the new configuration cuts detection to ten seconds and roughly halves the total outage.
    Every second has an owner. Detection dominates the outage. Cutting the death-detection threshold from 30s to 10s roughly halves the break — the other phases are fixed costs of restarting.

    I cut the detection threshold from 30 to 10 seconds, bringing the worst case to roughly half a minute. And then I deliberately stopped.

    Why did I not go lower?

    The tempting next move was obvious: if ten seconds is better than thirty, isn’t six better than ten? The answer to this obvious question is “No”. And the reason is one of the most useful ideas in this whole episode.

    Streaming rides on a transport layer that is designed to survive short losses: when packets drop, it silently retransmits with growing pauses — one second, two, four. A five-to-seven-second stall on a lossy link, or a brief CPU choke on the encoder machine, frequently recovers on its own. Every listener’s buffer absorbs it. Silence, then continuity. This is a non-event.

    Set the death-detection timer inside that self-healing window, and you convert those non-events into executions.

    Timeline of a network stall that would recover on its own at seven seconds. A six-second timeout kills the connection before it heals, triggering a full twenty-five-second restart; a ten-second timeout lets the stall heal and avoids the restart.
    The false-kill trap. An aggressive timeout doesn’t make recovery faster — it makes the system trigger-happy. Every false kill costs vastly more than the seconds of detection it saves.

    At second six, the server kills a connection that would have recovered at second seven. This will trigger a full restart cycle for a blip that needed nothing. An aggressive timeout doesn’t make the system more responsive; it makes it trigger-happy, and every false kill costs vastly more than the seconds of detection it saves. I think ten seconds is just the right amount of patience and is beyond ordinary loss recovery. And this is well short of human perception of a real outage.

    The lesson: in any system with self-healing layers underneath, impatience at the top destroys the healing below. Give the lower layers room to do their job before declaring anything dead.

    How many times to knock before walking away

    The encoder’s retry setting was next. The engineering reflex says: retry forever, retries are free. But the right answer came from operational experience, not technical experience. My runbook says any outage beyond a couple of minutes triggers a human response — backup encoder, secondary internet line. If a failed primary machine kept retrying for an hour, it might seize the stream back just as someone brings the backup online — two encoders fighting over one stream name, mid-transmission.

    So I chose sixty retries — about two minutes. Long enough to outlast any genuine blip; short enough that when it expires, the machine takes itself out of contention exactly when a human takes over. The retry limit isn’t a technical parameter at all; instead, it is a handoff protocol between automation and people, and it must match the playbook, not be maximized in isolation.

    The cleanup script that almost knifed me

    One last trap, and it’s a beautiful illustration of how fixes breed new bugs. I have a cleanup script that runs whenever a publisher disconnects. It would delete the stream’s files, so late joiners to a genuinely ended stream got a clean “not found” rather than a frozen playlist.
    To me it looked sensible when I wrote the script. But the disconnect hook fires on every disconnect, including transient ones. The script waited fifteen seconds, checked whether the stream was back, and if not, deleted everything.

    Now, when I traced that sixty-second blip through that logic, I realized that the encoder is still inside its two-minute retry budget, mid-recovery — while the cleanup script has already declared the stream dead and deleted the playlists out from under it.

    Timeline showing three components disagreeing about when a stream is dead. The origin gives up at ten seconds, the old cleanup script deletes files at twenty-five seconds, and the encoder keeps retrying until two minutes — so cleanup deletes playlists while the encoder is still recovering.
    Three definitions of “dead.” The origin said 10s, the cleanup said 25s, the encoder said 120s. The most impatient component sabotaged the others — deleting playlists while recovery was still in flight.

    That distinction matters enormously to the software on people’s phones. A playlist that’s present but unchanging is met with near-infinite patience. The players will poll it and resume seamlessly when it updates. A missing playlist makes players give up fast. The cleanup script was transforming the most forgiving failure mode into the least forgiving one, at the worst possible moment.

    The fix: teach the script the same patience as the encoder. It now waits out the full retry window (exiting early the moment the publisher returns), holds a lock so overlapping runs from a flapping connection can’t interleave, and only deletes once the encoder has demonstrably given up. By this time, the stream is already on air using a backup encoder and/or backup ISP. Every timeout in the recovery chain now agrees with every other.

    The lesson — and the thesis of this whole post: recovery machinery must share one coherent definition of “dead.” Mine had three, and the most impatient component sabotaged the rest. Audit your timeouts as a set, not one by one.

    The quiet hero: twelve-second chunks

    A closing observation for anyone tempted by ultra-low-latency streaming. My chunks are twelve seconds long, which means standard players start about thirty-six seconds behind live — three chunks of buffer. That cushion is why, after all these fixes, most of my audience experiences a network drop at the venue as if there were literally nothing. The entire recovery completes while their player calmly drains its buffer.

    Bar comparison showing a 36-second player buffer against a roughly 30-second outage. Because the buffer outlasts the outage, the listener hears nothing.
    Latency buys resilience. Had I chased low latency with 2-second chunks, the cushion would be 6 seconds, and every blip would stall every listener. For a live discourse, nobody minds being 40 seconds behind — everybody minds a silence.

    Latency and resilience trade against each other, and the right balance is dictated by the content, not by fashion.

    The Takeaway

    If you lead a team: when told “it’s broken” and “it works fine” at once, believe both — the difference is usually hidden state (caches, buffers, session history) that makes identical requests receive different answers. And after an incident, the question isn’t “what failed?” but “which of our optimizations assumed this could never happen?”

    If you’re an engineer: make identifiers globally unique so caching assumptions can’t be violated (a clock is a free counter). Derive cache lifetimes from data lifecycle. Respect the self-healing windows below you before declaring anything dead. Set retry budgets to hand off cleanly to human procedures. Align all timeouts to a single shared definition of failure.

    None of the individual fixes was clever — clock-based numbering, a shorter cache header, a tuned timeout, a retry count, a patient cleanup script; each is a few lines. The value was in the diagnosis: reading five servers erroring in unison as an arrow pointing upstream, decomposing sixty seconds into its owners, and noticing that the system’s worst behavior emerged not from any component failing, but from correct components holding contradictory beliefs about time.

    That, in the end, is what most production troubleshooting is: not finding the broken part, but finding the disagreement.

  • Rethinking Resilience in the Age of Agentic AI

    A short while back, I wrote a series on Resilience, focusing on why automated recovery isn’t optional anymore. (If you missed the first post, you can find it here: [The Unseen Heroes: Why Automated System Recovery Isn’t Optional Anymore]).

    The argument that human speed cannot match machine speed, is now facing its ultimate test. We are witnessing the rise of Agentic AI. Agentic AI is a new class of autonomous attacker operating at light speed, capable of learning, adapting, and executing a complete breach before human teams even fully wake up.

    This evolution demands more than recovery; it requires an ironclad strategy for automated, complete infrastructure rebuild.

    Autonomy That Learns and Adapts

    For years, the threat landscape escalated from small hacking groups to the proliferation of the Ransomware-as-a-Service (RaaS) model. RaaS democratized cybercrime, allowing moderately skilled criminals to rent sophisticated tools on the dark web for a subscription fee (learn more about the RaaS model here: What is Ransomware-as-a-Service (RaaS)?).

    The emergence of Agentic AI is the next fundamental leap.

    Unlike Generative AI, which simply assists with tasks, Agentic AI is proactive, autonomous, and adaptive. These AI agents don’t follow preprogrammed scripts; they learn on the fly, tailoring their attack strategies to the specific environment they encounter.

    For criminals, Agentic AI is a powerful tool because it drastically lowers the barrier to entry for sophisticated attacks. By automating complex tasks like reconnaissance and tailored phishing, these systems can orchestrate campaigns faster and more affordably than hiring large teams of human hackers, ultimately making cybercrime more accessible and attractive (Source: UC Berkeley CLTC)

    Agentic ransomware represents a collection of bots that execute every step of a successful attack faster and better than human operators. The implications for recovery are profound: you are no longer fighting a team of humans, but an army of autonomous systems.

    The Warning Signs Are Already Here

    Recent high-profile incidents illustrate that no industry is safe, and the time-to-breach window is shrinking:

    • Change Healthcare (Early 2024): This major incident demonstrated how a single point of failure can catastrophically disrupt the U.S. healthcare system, underscoring the severity of supply-chain attacks (Read incident details here).
    • Snowflake & Ticketmaster (Mid-2024): A sophisticated attack that exploited stolen credentials to compromise cloud environments, leading to massive data theft and proving that third-party cloud services are not magically resilient on their own (Learn more about the Snowflake/Ticketmaster breach).
    • The Rise of Non-Human Identity (NHI) Exploitation (2025): Security experts warn that 2025 is seeing a surge in attacks exploiting Non-Human Identities (API keys, service accounts). These high-privilege credentials, often poorly managed, are prime targets for autonomous AI agents seeking to move laterally without detection (Read more on 2025 NHI risks).

    The Myth of Readiness in a Machine-Speed World

    When faced with an attacker operating at machine velocity, relying solely on prevention-focused security creates a fragile barrier.

    So, why do well-funded organizations still struggle? In many cases, the root cause lies within. Organizations are undermined by a series of internal fractures:

    Siloed Teams and Fragmented Processes

    When cybersecurity, cloud operations, application development and business-continuity teams function in isolation, vital information becomes trapped inside departmental silos, knowledge of application dependencies, network configurations or privileged credentials may live only in one team or one tool. Here are some examples –

    • Cisco Systems’s white-paper shows how siloed NetOps and SecOps teams lead to delayed detection and containment of vulnerability-events, undermining resilience.
    • An industry article highlights that when delivering a cloud-based service like Microsoft Teams, issues spread across device, network, security, service-owner and third-party teams—and when each team only worries about “is this our problem?” the root-cause is delayed.

    Organizations must now –

    • Integrate cross-functional teams and ensure shared ownership of outcomes.
    • Map and document critical dependencies across teams (apps, networks, credentials).
    • Use joint tools and run-books so knowledge isn’t locked in one group.

    Runbooks That Are Theoretical, Not Executable

    Policies and operational run-books often exist only in Wiki or Confluence pages. These are usually never tested end-to-end for a real-world crisis. When a disruption hits, these “prepare-on-paper” plans prove next-to-useless because they haven’t been executed, updated or validated in context. Some of the examples to illustrate this are –

    • A study on cloud migration failures emphasises that most issues aren’t purely technical, but stem from poor process, obscure roles and un-tested plans.
    • In the context of cloud migrations, the guidance “Top 10 Unexpected Cloud Migration Challenges” emphasises that post-migration testing and refinement are often skipped. This means that even when systems are live, recovery paths may not exist.

    The path forward lies in to –

    • Validate and rehears e run-books using realistic simulations, not just table-top reviews.
    • Ensure that documentation is maintained in a form that can be executed (scripts, automation, playbooks) not just “slides”.
    • Assign clear roles, triggers and escalation paths—every participant must know when and how they act.

    Over-Reliance on Cloud Migration as a Guarantee of Resilience

    Many organisations assume that migrating to the cloud automatically improves resilience. In reality, cloud migration only shifts the complexity: without fully validated rebuild paths, end-to-end environment re-provisioning and regular recovery testing, cloud-based systems can still fail under crisis.

    Real-world examples brings this challenge into focus –

    • A recent issue reported by Amazon Web Services (AWS) showed thousands of organisations facing outage due to a DNS error, reminding us that even “trusted” cloud platforms aren’t immune—and simply “being in the cloud” doesn’t equal resilience.
    • Research shows that “1 in 3 enterprise cloud migrations fail” to meet schedule or budget expectations, partly because of weak understanding of dependencies and recovery requirements.

    These underscores the importance to –

    • Treat cloud migration as an opportunity to rebuild resiliency, not assume it comes for free.
    • Map and test full application environment re-builds (resources, identities, configurations) under worst-case conditions.
    • Conduct regular fail-over and rebuild drills; validate that recovery is end-to-end and not just infrastructure-level.

    The risk is simple: The very worst time to discover a missing configuration file or an undocumented dependency is during your first attempt at a crisis rebuild.

    Building Back at Machine Speed

    The implications of Agentic AI are clear: you must be able to restore your entire infrastructure to a clean point-in-time state faster than the attacker can cause irreparable damage. The goal is no longer recovery (restoring data to an existing system), but a complete, automated rebuild.

    This capability rests on three pillars:

    1. Comprehensive Metadata Capture: Rebuilding requires capturing all relevant metadata—not just application data, but the configurations, Identity and Access Management (IAM) policies, networking topologies, resource dependencies, and API endpoints. This is the complete blueprint of your operational state.
    2. Infrastructure as Code (IaC): The rebuild process must be entirely code-driven. This means integrating previously manual or fragmented recovery steps into verifiable, executable code. IaC ensures that the environment is built back exactly as intended, eliminating human error.
    3. Automated Orchestration and Verification: This pillar ties the first two together. The rebuild cannot be a set of sequential manual scripts; it must be a single, automated pipeline that executes the IaC, restores the data/metadata, and verifies the new environment against a known good state before handing control back to the business. This orchestration ensures the rapid, clean point-in-time restoration required.

    By making your infrastructure definition and its restoration process code, you match the speed of the attack with the speed of your defense.

    Resilience at the Speed of Code

    Automating the full rebuild process transforms disaster recovery testing from an expensive chore into a strategic tool for cost optimization and continuous validation.

    Traditional disaster recovery tests are disruptive, costly, and prone to human error. When the rebuild is fully automated:

    • Validated Resilience: Testing can be executed frequently—even daily—without human intervention, providing continuous, high-confidence validation that your environment can be restored to a secure state.
    • Cost Efficiency: Regular automated rebuilds act as an audit tool. If the rebuild process reveals that your production environment only requires 70% of the currently provisioned resources to run effectively, you gain immediate, actionable insight for reducing infrastructure costs.
    • Simplicity and Consistency: Automated orchestration replaces complex, documented steps with verifiable, repeatable code, lowering operational complexity and the reliance on individual expertise during a high-pressure incident.

    Agentic AI has closed the window for slow, manual response. Resilience now means embracing the speed of code—making your restoration capability as fast, autonomous, and adaptive as the threat itself.

  • Beyond the Code: Building a Culture of Resilience & The Future of Recovery

    Welcome to the grand finale of our “Unseen Heroes” series! We’ve peeled back the layers of automated system recovery, from understanding why failures are inevitable to championing stateless agility, wrestling with stateful data dilemmas, and mastering the silent sentinels, the tools and tactics that keep things humming.

    But here’s the crucial truth: even the most sophisticated tech stack won’t save you if your strategy and, more importantly, your people, aren’t aligned. Automated recovery isn’t just a technical blueprint; it’s a living, breathing part of your organization’s DNA. Today, we go beyond the code to talk about the strategic patterns, the human element, and what the future holds for keeping our digital world truly resilient.

    Beyond the Blueprint: Choosing Your Disaster Recovery Pattern

    While individual components recover automatically, sometimes you need to recover an entire system or region. This is where Disaster Recovery (DR) Patterns come in – strategic approaches for getting your whole setup back online after a major event. Each pattern offers a different balance of RTO/RPO, cost, and complexity.

    The Pilot Light approach keeps the core infrastructure, such as databases with replicated data, running in a separate recovery region, but the compute layer (servers and applications) remains mostly inactive. When disaster strikes, these compute resources are quickly powered up, and traffic is redirected. This method is cost-effective, especially for non-critical systems or those with higher tolerance for downtime, but it does result in a higher RTO compared to more active solutions. The analogy of a stove’s pilot light fits well, you still need to turn on the burner before you can start cooking.

    A step up is the Warm Standby model, which maintains a scaled-down but active version of your environment in the recovery region. Applications and data replication are already running, albeit on smaller servers or with fewer instances. During a disaster, you simply scale up and reroute traffic, which results in a faster RTO than pilot light but at a higher operational cost. This is similar to a car with the engine idling, ready to go quickly but using fuel in the meantime.

    At the top end is Hot Standby / Active-Active, where both primary and recovery regions are fully functional and actively processing live traffic. Data is continuously synchronized, and failover is nearly instantaneous, offering near-zero RTO and RPO with extremely high availability. However, this approach involves the highest cost and operational complexity, including the challenge of maintaining data consistency across active sites. It is akin to having two identical cars driving side by side, if one breaks down, the other seamlessly takes over without missing a beat.

    The Human Element: Building a Culture of Resilience

    No matter how advanced your technology is, true resilience comes from people—their preparation, mindset, and ability to adapt under pressure.

    Consider a fintech company that simulates a regional outage every quarter by deliberately shutting down its primary database in Region East. The operations team, guided by clear runbooks, seamlessly triggers a failover to Region West. The drill doesn’t end with recovery; instead, the team conducts a blameless post-incident review, examining how alerts behaved, where delays occurred, and what could be automated further. Over time, these cycles of testing, reflection, and improvement create a system—and a team—that bounces back faster with every challenge.

    Resilience here is not an endpoint but a journey. From refining monitoring and automation to conducting hands-on training, everyone on the team knows exactly what to do when disaster strikes. Confidence is built through practice, not guesswork.

    Key elements of this culture include:

    • Regular DR Testing & Drills – Simulated outages and chaos engineering to uncover hidden issues.
    • Comprehensive Documentation & Runbooks – Clear, actionable guides for consistent responses.
    • Blameless Post-Incident Reviews – Focus on learning rather than blaming individuals.
    • Continuous Improvement – Iterating on automation, alerts, and processes after every incident.
    • Training & Awareness – Equipping every team member with the knowledge to act swiftly.

    A Story of Tomorrow’s Recovery Systems

    It’s 2 a.m. at Dhanda-Paani Finance Ltd, a global fintech startup. Normally, this would be the dreaded hour when an unexpected outage triggers panic among engineers. But tonight, something remarkable happens.

    An AI-powered monitoring system quietly scans millions of metrics and log entries, spotting subtle patterns—slightly slower database queries and minor memory spikes. Using machine learning models trained on historical incidents, it predicts that a failure might occur within the next 30 minutes. Before anyone notices, it reroutes traffic to a healthy cluster and applies a preventive patch. This is predictive resilience in action – the ability of AI/ML systems to see trouble coming and act before it becomes a real problem.

    Minutes later, another microservice shows signs of a memory leak. Rather than waiting for it to crash, Dhanda-Paani’s self-healing platform automatically spins up a fresh instance, drains traffic from the faulty one, and applies a quick fix. No human intervention is needed. It’s as if the infrastructure can diagnose and repair itself, much like a body healing a wound.

    All the while, a chaos agent is deliberately introducing small, controlled failures in production, shutting down random containers or delaying network calls, to test whether every layer of the system is as resilient as it should be. These proactive tests ensure the platform remains robust, no matter what surprises the real world throws at it.

    By morning, when the engineers check the dashboards, they don’t see outages or alarms. Instead, they see a series of automated decisions—proactive reroutes, self-healing actions, and chaos tests—all logged neatly. The system has spent the night not just surviving but improving itself, allowing the humans to focus on building new features instead of fighting fires.

    Conclusion: The Unseen Heroes, Always On Guard

    From accepting the inevitability of failure to mastering stateless agility, untangling stateful complexity, deploying silent sentinel tools, and nurturing a culture of resilience—we’ve journeyed through the intricate world of automated system recovery.

    But the real “Unseen Heroes” aren’t just hidden in lines of code or humming servers. They are the engineers who anticipate failures before they happen, the processes designed to adapt and recover, and the mindset that treats resilience not as a milestone but as an ongoing craft. Together, they ensure that our digital infrastructure stays available, consistent, and trustworthy—even when chaos strikes.

    In the end, automated recovery is more than technology; it’s a quiet pact between human ingenuity and machine intelligence, always working behind the scenes to keep the digital world turning.

    May your systems hum like clockwork, your failures whisper instead of roar, and your recovery be as effortless as the dawn breaking after a storm.

  • The Silent Sentinels: Tools and Tactics for Automated Recovery

    We’ve journeyed through the foundational principles of automated recovery, celebrated the lightning-fast resilience of stateless champions, and navigated the treacherous waters of stateful data dilemmas. Now, it’s time to pull back the curtain on the silent sentinels, the tools, tactics, and operational practices that knit all these recovery mechanisms together. These are the unsung heroes behind the “unseen heroes” if you will, constantly working behind the scenes to ensure your digital world remains upright.

    Think of it like building a super-secure, self-repairing fortress. You’ve got your strong walls and self-cleaning rooms, but you also need surveillance cameras, automated construction robots, emergency repair kits, and smart defense systems. That’s what these cross-cutting components are to automated recovery.

    The All-Seeing Eyes: Monitoring and Alerting

    You can’t fix what you don’t know is broken, right? Monitoring is literally the eyes and ears of your automated recovery system. It’s about continuously collecting data on your system’s health, performance, and resource utilization. Are your servers feeling sluggish? Is a database getting overwhelmed? Are error rates suddenly spiking? Monitoring tools are constantly watching, watching, watching.

    But just watching isn’t enough. When something goes wrong, you need to know immediately. That’s where alerting comes in. It’s the alarm bell that rings when a critical threshold is crossed (e.g., CPU usage hits 90% for five minutes, or error rates jump by 50%). Alerts trigger automated responses, notify engineers, or both.

    For example, imagine an online retail platform. Monitoring detects that latency for checkout requests has suddenly quadrupled. An alert immediately fires, triggering an automated scaling script that brings up more checkout servers, and simultaneously pings the on-call team. This happens before customers even notice a significant slowdown.

    The following flowchart visually convey the constant vigilance of monitoring and the immediate impact of alerting in automated recovery.

    Building by Blueprint: Infrastructure as Code (IaC)

    Back in the days we used to set up server and configure networks manually. I still remember installing SCO Unix, Windows 95/98/NT/2000, RedHat/Slackware Linux manually using 5.25 inch DSDD or 3.5 inch floppy drives, which were later replaced by CDs as an installation medium. It was slow, error-prone, and definitely not “automated recovery” friendly. Enter Infrastructure as Code (IaC). This is the practice of managing and provisioning your infrastructure (servers, databases, networks, load balancers, etc.) using code and version control, just like you manage application code.

    If a data center goes down, or you need to spin up hundreds of new servers for recovery, you don’t do it by hand. You simply run an IaC script (using tools like Terraform, CloudFormation, Ansible, Puppet). This script automatically provisions the exact infrastructure you need, configured precisely as it should be, every single time. It’s repeatable, consistent, and fast.

    Lets look at an example when a major cloud region experiences an outage affecting multiple servers for a SaaS application. Instead of manually rebuilding, the operations team triggers a pre-defined Terraform script. Within minutes, new virtual machines, network configurations, and load balancers are spun up in a different, healthy region, exactly replicating the desired state.

    Ship It & Fix It Fast: CI/CD Pipelines for Recovery

    Continuous Integration/Continuous Delivery (CI/CD) pipelines aren’t just for deploying new features; they’re vital for automated recovery too. A robust CI/CD pipeline ensures that code changes (including bug fixes, security patches, or even recovery scripts) are automatically tested and deployed quickly and reliably.

    In the context of recovery, CI/CD pipelines offer several key advantages. They enable rapid rollbacks, allowing teams to quickly revert to a stable version if a new deployment introduces issues. They also facilitate fast fix deployment, where critical bugs discovered during an outage can be swiftly developed, tested, and deployed with minimal manual intervention, effectively reducing downtime. Moreover, advanced deployment strategies such as canary releases or blue-green deployments, which are often integrated within CI/CD pipelines, make it possible to roll out new versions incrementally or in parallel with existing ones. These strategies help in quickly isolating and resolving issues while minimizing the potential impact of failures.

    For example, if a software bug starts causing crashes on production servers. The engineering team pushes a fix to their CI/CD pipeline. The pipeline automatically runs tests, builds new container images, and then deploys them using a blue/green strategy, gradually shifting traffic to the fixed version. If any issues are detected during the shift, it can instantly revert to the old, stable version, minimizing customer impact.

    The Digital Safety Net: Backup and Restore Strategies

    Even with all the fancy redundancy and replication, sometimes you just need to hit the “undo” button on a larger scale. That’s where robust backup and restore strategies come in. This involves regularly copying your data (and sometimes your entire system state) to a separate, secure location, so you can restore it if something truly catastrophic happens (like accidental data deletion, ransomware attack, or a regional disaster).

    If a massive accidental deletion occurs on a production database, the automated backups, taken hourly and stored in a separate cloud region, allow the database to be restored to a point just before the deletion occurred, minimizing data loss and recovery time.

    The Smart Defenders: Resilience Patterns

    Building robustness directly into an application’s code and architecture often involves adopting specific design patterns that anticipate failure and respond gracefully. Circuit breakers, for example, act much like their electrical counterparts by “tripping” when a service begins to fail, temporarily blocking requests to prevent overload or cascading failures. Once the set cooldown time has passed, they “reset” to test if the service has recovered. This mechanism prevents retry storms that could otherwise overwhelm a recovering service.

    For instance, in an e-commerce application, if a third-party payment gateway starts returning errors, a circuit breaker can halt further requests and redirect users to alternative payment methods or display a “try again later” message, ensuring that the failing gateway isn’t continuously hammered.

    The following is an example of circuit breaker implementation using Istio. The outlierDetection implements automatic ejection of unhealthy hosts when failures exceed thresholds. This effectively acts as a circuit breaker, stopping traffic to failing instances.

    apiVersion: networking.istio.io/v1alpha3
    kind: DestinationRule
    metadata:
    name: reviews-cb
    namespace: default
    spec:
    host: reviews.default.svc.cluster.local
    trafficPolicy:
    connectionPool:
    tcp:
    maxConnections: 100 # Maximum concurrent TCP connections
    http:
    http1MaxPendingRequests: 50 # Max pending HTTP requests
    maxRequestsPerConnection: 10 # Max requests per connection (keep-alive limit)
    maxRetries: 3 # Max retry attempts per connection
    outlierDetection:
    consecutive5xxErrors: 5 # Trip circuit after 5 consecutive 5xx responses
    interval: 10s # Check interval for ejection
    baseEjectionTime: 30s # How long to eject a host
    maxEjectionPercent: 50 # Max % of hosts to eject

    Bulkhead is another powerful resilience strategy, which draw inspiration from ship compartments. Bulkheads isolate failures within a single component so they do not bring down the entire system. This is achieved by allocating dedicated resources—such as thread pools or container clusters—to each microservice or critical subsystem.

    In the above Istio configration there is another line in the config – connectionPool, which controls the maximum number of concurrent connections and queued requests. This is equivalent to the “bulkhead” concept, preventing one service from exhausting all resources.

    In practice, if your backend architecture separates user profiles, order processing, and product search into different microservices, a crash in the product search component won’t affect the availability of user profiles or order processing services, allowing the rest of the system to function normally.

    Additional patterns like rate limiting and retries with exponential backoff further enhance system resilience.

    Rate limiting controls the volume of incoming requests, protecting services from being overwhelmed by sudden spikes in traffic, whether malicious or legitimate. The following code is a sample rate limiting snipped from nginx (leaky bucket via limit_req):

    http {
    # shared zone 'api' with 10MB of state, 5 req/sec
    limit_req_zone $binary_remote_addr zone=api:10m rate=5r/s;

    server {
    location /api/ {
    limit_req zone=api burst=10 nodelay;
    proxy_pass http://backend;
    }
    }
    }

    Exponential backoff ensures that failed requests are retried gradually—waiting 1 second, then 2, then 4, and so forth—giving struggling services time to recover without being bombarded by immediate retries.

    For example, if an application attempts to connect to a temporarily unavailable database, exponential backoff provides breathing room for the database to restart and stabilize. Together, these cross-cutting patterns form the foundational operational pillars of automated system recovery, creating a self-healing ecosystem where resilience is woven into every layer of the infrastructure.

    Consider the following code snippet where retries with exponential backoff is implemented. I have not tested this code and this is just a quick implementation to explain the concept –

    import random
    import time

    def exponential_backoff_retry(fn, max_attempts=5, base=0.5, factor=2, max_delay=30):
    delay = base
    last_exc = None

    for attempt in range(1, max_attempts + 1):
    try:
    return fn()
    except RetryableError as e: # define/classify your retryable errors
    last_exc = e
    if attempt == max_attempts:
    break
    # full jitter
    sleep_for = random.uniform(0, min(delay, max_delay))
    time.sleep(sleep_for)
    delay = min(delay * factor, max_delay)

    raise last_exc

    In our next and final blog post, we’ll shift our focus to the bigger picture: different disaster recovery patterns and the crucial human element, how teams adopt, test, and foster a culture of resilience. Get ready for the grand finale!

  • The Data Dilemma: Mastering Recovery for Stateful Applications

    Welcome back to “The Unseen Heroes” series! In our last post, we celebrated the “forgetful champions”—stateless applications—and how their lack of memory makes them incredibly agile and easy to recover. Today, we’re tackling their more complex cousins: stateful applications. These are the digital equivalent of that friend who remembers everything—your coffee order from three years ago, that embarrassing story from high school, and every single detail of your last conversation. And while that memory is incredibly useful, it makes recovery a whole different ballgame.

    The Memory Keepers: What Makes Stateful Apps Tricky?

    Unlike their stateless counterparts, stateful applications are designed to remember things. They preserve client session information, transaction details, or persistent data on the server side between requests. They retain context about past interactions, often storing this crucial information in a database, a distributed memory system, or even on local drives.  

    Think of it like this:

    • Your online shopping cart: When you add items, close your browser, and come back later, your items are still there. That’s a stateful application remembering your session.
    • A multiplayer online game: The game needs to remember your character’s progress, inventory, and position in the world, even if you log out and back in.
    • A database: The ultimate memory keeper, storing all your critical business data persistently.

    This “memory” is incredibly powerful, but it introduces a unique set of challenges for automated recovery:

    • State Management is a Headache: Because they remember, stateful apps need meticulous coordination to ensure data integrity and consistency during updates or scaling operations. It’s like trying to keep a dozen meticulous librarians perfectly in sync, all updating the same book at the same time.  
    • Data Persistence is Paramount: Containers, by nature, are ephemeral—they’re designed to be temporary. Any data stored directly inside a container is lost when it vanishes. Stateful applications, however, need their data to live on, requiring dedicated persistent storage solutions like databases or distributed file systems.  
    • Scalability is a Puzzle: Scaling stateful systems horizontally is much harder than stateless ones. You can’t just spin up a new instance and expect it to know everything. It requires sophisticated data partitioning, robust synchronization methods, and careful management of shared state across instances.  
    • Recovery Time is Slower: The recovery process for stateful applications is generally more complex and time-consuming. It often involves promoting a secondary replica to primary and may require extensive data synchronization to restore the correct state. We’re talking seconds to minutes for well-optimized systems, but it can be longer if extensive data synchronization is needed.

    The following image visually contrast the simplicity of stateless recovery with the inherent complexities of stateful recovery, emphasizing the challenges.

    The Art of Copying: Data Replication Strategies

    Since data is the heart of a stateful application, making copies—or data replication—is absolutely critical. This means creating and maintaining identical copies of your data across multiple locations to ensure it’s always available, reliable, and fault-tolerant. It’s like having multiple identical copies of a priceless historical document, stored in different vaults.  

    The replication process usually involves two main steps:

    1. Data Capture: Recording changes made to the original data (e.g., by looking at transaction logs or taking snapshots).
    2. Data Distribution: Sending those captured changes to the replica systems, which might be in different data centers or even different geographical regions.  

    Now, not all copies are made equal. The biggest decision in data replication is choosing between synchronous and asynchronous replication, which directly impacts your RPO (how much data you can lose), cost, and performance.

    Synchronous Replication: The “Wait for Confirmation” Method

    How it works: Data is written to both the primary storage and the replica at the exact same time. The primary system won’t confirm the write until both copies are updated.

    The Good: Guarantees strong consistency (zero data loss, near-zero RPO) and enables instant failover. This is crucial for high-stakes applications like financial transaction processing, healthcare systems, or e-commerce order processing where losing even a single record is a disaster.  

    The Catch: It’s generally more expensive, introduces latency (it slows down the primary application because it has to wait), and is limited by distance (typically up to 300 km). Imagine two people trying to write the same sentence on two whiteboards at the exact same time, and neither can move on until both are done. It’s precise, but slow if they’re far apart.

    Asynchronous Replication: The “I’ll Catch Up Later” Method

    How it works: Data is first written to the primary storage, and then copied to the replica at a later time, often in batches.

    The Good: Less costly, can work effectively over long distances, and is more tolerant of network hiccups because it doesn’t demand real-time synchronization. Great for disaster recovery sites far away.  

    The Catch: Typically provides eventual consistency, meaning replicas might temporarily serve slightly older data. This results in a non-zero RPO (some data loss is possible). It’s like sending a copy of your notes to a friend via snail mail – they’ll get them eventually, but they won’t be perfectly up-to-date in real-time.

    The above diagram clearly illustrates the timing, consistency, and trade-offs of synchronous vs. asynchronous replications.

    Beyond synchronous and asynchronous, there are various specific replication strategies, each with its own quirks:

    • Full Table Replication: Copying the entire database. Great for initial setup or when you just need a complete snapshot, but resource-heavy.  
    • Log-Based Incremental Replication: Only copying the changes recorded in transaction logs. Efficient for real-time updates, but specific to certain databases.  
    • Snapshot Replication: Taking a point-in-time “photo” of the data and replicating that. Good for smaller datasets or infrequent updates, but not real-time.  
    • Key-Based Incremental Replication: Copying changes based on a specific column (like an ID or timestamp). Efficient, but might miss deletions.  
    • Merge Replication: Combining multiple databases, allowing changes on all, with built-in conflict resolution. Complex, but offers continuity.  
    • Transactional Replication: Initially copying all data, then mirroring changes sequentially in near real-time. Good for read-heavy systems.  
    • Bidirectional Replication: Two databases actively exchanging data, with no single “source.” Great for full utilization, but high conflict risk.  

    The key takeaway here is that for stateful applications, you’ll likely use a tiered replication strategy, applying synchronous methods for your most mission-critical data (where zero RPO is non-negotiable) and asynchronous for less time-sensitive workloads.  

    Orchestrating the Chaos: Advanced Consistency & Failover

    Simply copying data isn’t enough. Stateful applications need sophisticated conductors to ensure everything stays in tune, especially during a crisis.

    Distributed Consensus Algorithms

    These are the “agreement protocols” for your distributed system. Algorithms like Paxos and Raft help disparate computers agree on critical decisions, even if some nodes fail or get disconnected. They’re vital for maintaining data integrity and consistency across the entire system, especially during failovers or when a new “leader” needs to be elected in a database cluster.

    Kubernetes StatefulSets

    For stateful applications running in containers (like databases or message queues), Kubernetes offers StatefulSets. These are specifically designed to manage stateful workloads, providing stable, unique network identifiers and, crucially, persistent storage for each Pod (your containerized application instance).

    • Persistent Volumes (PVs) & Persistent Volume Claims (PVCs): StatefulSets work hand-in-hand with PVs and PVCs, which are Kubernetes’ way of providing dedicated, durable storage that persists even if the Pod restarts or moves to a different node. This means your data isn’t lost when a container dies.
    • The Catch (again): While StatefulSets are powerful, Kubernetes itself doesn’t inherently provide data consistency or transactional guarantees. That’s still up to your application or external tools. Also, disruptions to StatefulSets can take longer to resolve than for stateless Pods, and Kubernetes doesn’t natively handle backup and disaster recovery for persistent storage, so you’ll need third-party solutions.

      Decoupling State and Application Logic

      This is a golden rule for modern stateful apps. Instead of having your application directly manage its state on local disks, you separate the application’s core logic (which can be stateless!) from its persistent data. The data then lives independently in dedicated, highly available data stores like managed databases or caching layers. This allows your application instances to remain ephemeral and easily replaceable, while the complex job of state management, replication, and consistency is handled by specialized data services. It’s like having a separate, highly secure vault for your important documents, rather than keeping them scattered in every office.

      So, while stateful applications bring a whole new level of complexity to automated recovery, the good news is that modern architectural patterns and cloud-native tools provide powerful ways to manage their “memory” and ensure data integrity and availability during failures. It’s about smart design, robust replication, and leveraging the right tools for the job.

      In our next blog post, we’ll zoom out and look at the cross-cutting components that are essential for any automated recovery framework, whether you’re dealing with stateless or stateful apps. We’ll talk about monitoring, Infrastructure as Code, and the different disaster recovery patterns. Stay tuned!