Ajitabh Pandey's Soul & Syntax

Exploring systems, souls, and stories – one post at a time

Tag: DevOps

  • Why Systemd Timers Outshine Cron Jobs

    For decades, cron has been the trusty workhorse for scheduling tasks on Linux systems. Need to run a backup script daily? cron was your go-to. But as modern systems evolve and demand more robust, flexible, and integrated solutions, systemd timers have emerged as a superior alternative. Let’s roll up our sleeves and dive into the strategic advantages of systemd timers, then walk through their design and implementation..

    Why Ditch Cron? The Strategic Imperative

    While cron is simple and widely understood, it comes with several inherent limitations that can become problematic in complex or production environments:

    • Limited Visibility and Logging: cron offers basic logging (often just mail notifications) and lacks a centralized way to check job status or output. Debugging failures can be a nightmare.
    • No Dependency Management: cron jobs are isolated. There’s no built-in way to ensure one task runs only after another has successfully completed, leading to potential race conditions or incomplete operations.
    • Missed Executions on Downtime: If a system is off during a scheduled cron run, that execution is simply missed. This is critical for tasks like backups or data synchronization.
    • Environment Inconsistencies: cron jobs run in a minimal environment, often leading to issues with PATH variables or other environmental dependencies that work fine when run manually.
    • No Event-Based Triggering: cron is purely time-based. It cannot react to system events like network availability, disk mounts, or the completion of other services.
    • Concurrency Issues: cron doesn’t inherently prevent multiple instances of the same job from running concurrently, which can lead to resource contention or data corruption.

    systemd timers, on the other hand, address these limitations by leveraging the full power of the systemd init system. (We’ll dive deeper into the intricacies of the systemd init system itself in a future post!)

    • Integrated Logging with Journalctl: All output and status information from systemd timer-triggered services are meticulously logged in the systemd journal, making debugging and monitoring significantly easier (journalctl -u your-service.service).
    • Robust Dependency Management: systemd allows you to define intricate dependencies between services. A timer can trigger a service that requires another service to be active, ensuring proper execution order.
    • Persistent Timers (Missed Job Handling): With the Persistent=true option, systemd timers will execute a missed job immediately upon system boot, ensuring critical tasks are never truly skipped.
    • Consistent Execution Environment: systemd services run in a well-defined environment, reducing surprises due to differing PATH or other variables. You can explicitly set environment variables within the service unit.
    • Flexible Triggering Mechanisms: Beyond simple calendar-based schedules (like cron), systemd timers support monotonic timers (e.g., “5 minutes after boot”) and can be combined with other systemd unit types for event-driven automation.
    • Concurrency Control: systemd inherently manages service states, preventing multiple instances of the same service from running simultaneously unless explicitly configured to do so.
    • Granular Control: Timers offer second-resolution scheduling (with AccuracySec=1us), allowing for much more precise control than cron‘s minute-level resolution.
    • Randomized Delays: RandomizedDelaySec can be used to prevent “thundering herd” issues where many timers configured for the same time might all fire simultaneously, potentially overwhelming the system.

    Designing Your Systemd Timers: A Two-Part Harmony

    systemd timers operate in a symbiotic relationship with systemd service units. You typically create two files for each scheduled task:

    1. A Service Unit (.service file): This defines what you want to run (e.g., a script, a command).
    2. A Timer Unit (.timer file): This defines when you want the service to run.

    Both files are usually placed in /etc/systemd/system/ for system-wide timers or ~/.config/systemd/user/ for user-specific timers.

    The Service Unit (your-task.service)

    This file is a standard systemd service unit. A basic example:

    [Unit]
    Description=My Daily Backup Service
    Wants=network-online.target # Optional: Ensure network is up before running
    
    [Service]
    Type=oneshot # For scripts that run and exit
    ExecStart=/usr/local/bin/backup-script.sh # The script to execute
    User=youruser # Run as a specific user (optional, but good practice)
    Group=yourgroup # Run as a specific group (optional)
    # Environment="PATH=/usr/local/bin:/usr/bin:/bin" # Example: set a custom PATH
    
    [Install]
    WantedBy=multi-user.target # Not strictly necessary for timers, but good for direct invocation
    

    Strategic Design Considerations for Service Units:

    • Type=oneshot: Ideal for scripts that perform a task and then exit.
    • ExecStart: Always use absolute paths for your scripts and commands to avoid environment-related issues.
    • User and Group: Run services with the least necessary privileges. This enhances security.
    • Dependencies (Wants, Requires, After, Before): Leverage systemd‘s powerful dependency management. For example, Wants=network-online.target ensures the network is active before the service starts.
    • Error Handling within Script: While systemd provides good logging, your scripts should still include robust error handling and exit with non-zero status codes on failure.
    • Output: Direct script output to stdout or stderr. journald will capture it automatically. Avoid sending emails directly from the script unless absolutely necessary; systemd‘s logging is usually sufficient.

    The Timer Unit (your-task.timer)

    This file defines the schedule for your service.

    [Unit]
    Description=Timer for My Daily Backup Service
    Requires=your-task.service # Ensure the service unit is loaded
    After=your-task.service # Start the timer after the service is defined
    
    [Timer]
    OnCalendar=daily # Run every day at midnight (default for 'daily')
    # OnCalendar=*-*-* 03:00:00 # Run every day at 3 AM
    # OnCalendar=Mon..Fri 18:00:00 # Run weekdays at 6 PM
    # OnBootSec=5min # Run 5 minutes after boot
    Persistent=true # If the system is off, run immediately on next boot
    RandomizedDelaySec=300 # Add up to 5 minutes of random delay to prevent stampedes
    
    [Install]
    WantedBy=timers.target # Essential for the timer to be enabled at boot
    

    Strategic Design Considerations for Timer Units:

    • OnCalendar: This is your primary scheduling mechanism. systemd offers a highly flexible calendar syntax (refer to man systemd.time for full details). Use systemd-analyze calendar "your-schedule" to test your expressions.
    • OnBootSec: Useful for tasks that need to run a certain duration after the system starts, regardless of the calendar date.
    • Persistent=true: Crucial for reliability! This ensures your task runs even if the system was powered off during its scheduled execution time. The task will execute once systemd comes back online.
    • RandomizedDelaySec: A best practice for production systems, especially if you have many timers. This spreads out the execution of jobs that might otherwise all start at the exact same moment.
    • AccuracySec: Defaults to 1 minute. Set to 1us for second-level precision if needed (though 1s is usually sufficient).
    • Unit: This explicitly links the timer to its corresponding service unit.
    • WantedBy=timers.target: This ensures your timer is enabled and started automatically when the system boots.

    Implementation and Management

    1. Create the files: Place your .service and .timer files in /etc/systemd/system/.
    2. Reload systemd daemon: After creating or modifying unit files: sudo systemctl daemon-reload
    3. Enable the timer: This creates a symlink so the timer starts at boot: sudo systemctl enable your-task.timer
    4. Start the timer: This activates the timer for the current session: sudo systemctl start your-task.timer
    5. Check status: sudo systemctl status your-task.timer; sudo systemctl status your-task.service
    6. View logs: journalctl -u your-task.service
    7. Manually trigger the service (for testing): sudo systemctl start your-task.service

    Conclusion

    While cron served its purpose admirably for many years, systemd timers offer a modern, robust, and integrated solution for scheduling tasks on Linux systems. By embracing systemd timers, you gain superior logging, dependency management, missed-job handling, and greater flexibility, leading to more reliable and maintainable automation. It’s a strategic upgrade that pays dividends in system stability and ease of troubleshooting. Make the switch and experience the power of a truly systemd-native approach to scheduled tasks.

  • Beyond the Code: Building a Culture of Resilience & The Future of Recovery

    Welcome to the grand finale of our “Unseen Heroes” series! We’ve peeled back the layers of automated system recovery, from understanding why failures are inevitable to championing stateless agility, wrestling with stateful data dilemmas, and mastering the silent sentinels, the tools and tactics that keep things humming.

    But here’s the crucial truth: even the most sophisticated tech stack won’t save you if your strategy and, more importantly, your people, aren’t aligned. Automated recovery isn’t just a technical blueprint; it’s a living, breathing part of your organization’s DNA. Today, we go beyond the code to talk about the strategic patterns, the human element, and what the future holds for keeping our digital world truly resilient.

    Beyond the Blueprint: Choosing Your Disaster Recovery Pattern

    While individual components recover automatically, sometimes you need to recover an entire system or region. This is where Disaster Recovery (DR) Patterns come in – strategic approaches for getting your whole setup back online after a major event. Each pattern offers a different balance of RTO/RPO, cost, and complexity.

    The Pilot Light approach keeps the core infrastructure, such as databases with replicated data, running in a separate recovery region, but the compute layer (servers and applications) remains mostly inactive. When disaster strikes, these compute resources are quickly powered up, and traffic is redirected. This method is cost-effective, especially for non-critical systems or those with higher tolerance for downtime, but it does result in a higher RTO compared to more active solutions. The analogy of a stove’s pilot light fits well, you still need to turn on the burner before you can start cooking.

    A step up is the Warm Standby model, which maintains a scaled-down but active version of your environment in the recovery region. Applications and data replication are already running, albeit on smaller servers or with fewer instances. During a disaster, you simply scale up and reroute traffic, which results in a faster RTO than pilot light but at a higher operational cost. This is similar to a car with the engine idling, ready to go quickly but using fuel in the meantime.

    At the top end is Hot Standby / Active-Active, where both primary and recovery regions are fully functional and actively processing live traffic. Data is continuously synchronized, and failover is nearly instantaneous, offering near-zero RTO and RPO with extremely high availability. However, this approach involves the highest cost and operational complexity, including the challenge of maintaining data consistency across active sites. It is akin to having two identical cars driving side by side, if one breaks down, the other seamlessly takes over without missing a beat.

    The Human Element: Building a Culture of Resilience

    No matter how advanced your technology is, true resilience comes from people—their preparation, mindset, and ability to adapt under pressure.

    Consider a fintech company that simulates a regional outage every quarter by deliberately shutting down its primary database in Region East. The operations team, guided by clear runbooks, seamlessly triggers a failover to Region West. The drill doesn’t end with recovery; instead, the team conducts a blameless post-incident review, examining how alerts behaved, where delays occurred, and what could be automated further. Over time, these cycles of testing, reflection, and improvement create a system—and a team—that bounces back faster with every challenge.

    Resilience here is not an endpoint but a journey. From refining monitoring and automation to conducting hands-on training, everyone on the team knows exactly what to do when disaster strikes. Confidence is built through practice, not guesswork.

    Key elements of this culture include:

    • Regular DR Testing & Drills – Simulated outages and chaos engineering to uncover hidden issues.
    • Comprehensive Documentation & Runbooks – Clear, actionable guides for consistent responses.
    • Blameless Post-Incident Reviews – Focus on learning rather than blaming individuals.
    • Continuous Improvement – Iterating on automation, alerts, and processes after every incident.
    • Training & Awareness – Equipping every team member with the knowledge to act swiftly.

    A Story of Tomorrow’s Recovery Systems

    It’s 2 a.m. at Dhanda-Paani Finance Ltd, a global fintech startup. Normally, this would be the dreaded hour when an unexpected outage triggers panic among engineers. But tonight, something remarkable happens.

    An AI-powered monitoring system quietly scans millions of metrics and log entries, spotting subtle patterns—slightly slower database queries and minor memory spikes. Using machine learning models trained on historical incidents, it predicts that a failure might occur within the next 30 minutes. Before anyone notices, it reroutes traffic to a healthy cluster and applies a preventive patch. This is predictive resilience in action – the ability of AI/ML systems to see trouble coming and act before it becomes a real problem.

    Minutes later, another microservice shows signs of a memory leak. Rather than waiting for it to crash, Dhanda-Paani’s self-healing platform automatically spins up a fresh instance, drains traffic from the faulty one, and applies a quick fix. No human intervention is needed. It’s as if the infrastructure can diagnose and repair itself, much like a body healing a wound.

    All the while, a chaos agent is deliberately introducing small, controlled failures in production, shutting down random containers or delaying network calls, to test whether every layer of the system is as resilient as it should be. These proactive tests ensure the platform remains robust, no matter what surprises the real world throws at it.

    By morning, when the engineers check the dashboards, they don’t see outages or alarms. Instead, they see a series of automated decisions—proactive reroutes, self-healing actions, and chaos tests—all logged neatly. The system has spent the night not just surviving but improving itself, allowing the humans to focus on building new features instead of fighting fires.

    Conclusion: The Unseen Heroes, Always On Guard

    From accepting the inevitability of failure to mastering stateless agility, untangling stateful complexity, deploying silent sentinel tools, and nurturing a culture of resilience—we’ve journeyed through the intricate world of automated system recovery.

    But the real “Unseen Heroes” aren’t just hidden in lines of code or humming servers. They are the engineers who anticipate failures before they happen, the processes designed to adapt and recover, and the mindset that treats resilience not as a milestone but as an ongoing craft. Together, they ensure that our digital infrastructure stays available, consistent, and trustworthy—even when chaos strikes.

    In the end, automated recovery is more than technology; it’s a quiet pact between human ingenuity and machine intelligence, always working behind the scenes to keep the digital world turning.

    May your systems hum like clockwork, your failures whisper instead of roar, and your recovery be as effortless as the dawn breaking after a storm.

  • The Silent Sentinels: Tools and Tactics for Automated Recovery

    We’ve journeyed through the foundational principles of automated recovery, celebrated the lightning-fast resilience of stateless champions, and navigated the treacherous waters of stateful data dilemmas. Now, it’s time to pull back the curtain on the silent sentinels, the tools, tactics, and operational practices that knit all these recovery mechanisms together. These are the unsung heroes behind the “unseen heroes” if you will, constantly working behind the scenes to ensure your digital world remains upright.

    Think of it like building a super-secure, self-repairing fortress. You’ve got your strong walls and self-cleaning rooms, but you also need surveillance cameras, automated construction robots, emergency repair kits, and smart defense systems. That’s what these cross-cutting components are to automated recovery.

    The All-Seeing Eyes: Monitoring and Alerting

    You can’t fix what you don’t know is broken, right? Monitoring is literally the eyes and ears of your automated recovery system. It’s about continuously collecting data on your system’s health, performance, and resource utilization. Are your servers feeling sluggish? Is a database getting overwhelmed? Are error rates suddenly spiking? Monitoring tools are constantly watching, watching, watching.

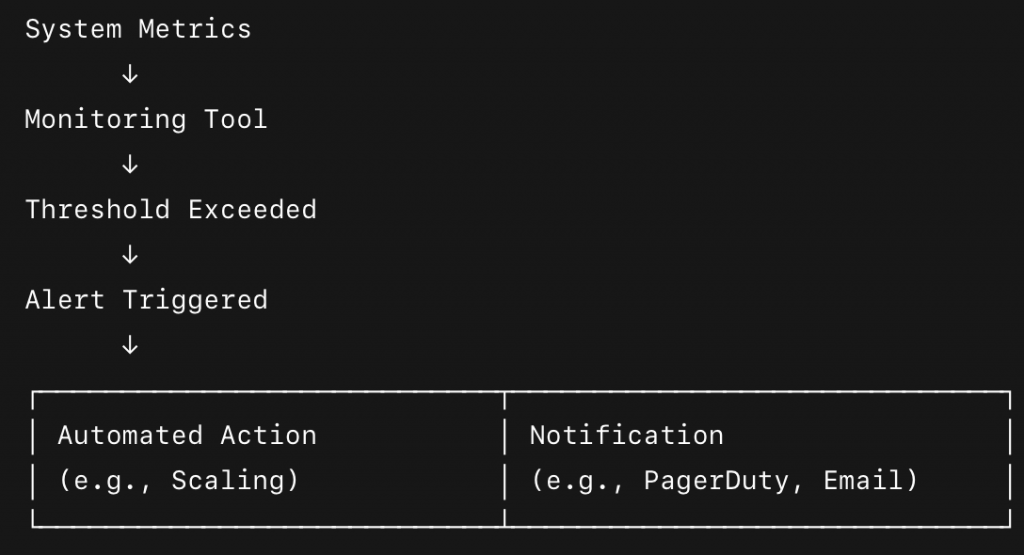
    But just watching isn’t enough. When something goes wrong, you need to know immediately. That’s where alerting comes in. It’s the alarm bell that rings when a critical threshold is crossed (e.g., CPU usage hits 90% for five minutes, or error rates jump by 50%). Alerts trigger automated responses, notify engineers, or both.

    For example, imagine an online retail platform. Monitoring detects that latency for checkout requests has suddenly quadrupled. An alert immediately fires, triggering an automated scaling script that brings up more checkout servers, and simultaneously pings the on-call team. This happens before customers even notice a significant slowdown.

    The following flowchart visually convey the constant vigilance of monitoring and the immediate impact of alerting in automated recovery.

    Building by Blueprint: Infrastructure as Code (IaC)

    Back in the days we used to set up server and configure networks manually. I still remember installing SCO Unix, Windows 95/98/NT/2000, RedHat/Slackware Linux manually using 5.25 inch DSDD or 3.5 inch floppy drives, which were later replaced by CDs as an installation medium. It was slow, error-prone, and definitely not “automated recovery” friendly. Enter Infrastructure as Code (IaC). This is the practice of managing and provisioning your infrastructure (servers, databases, networks, load balancers, etc.) using code and version control, just like you manage application code.

    If a data center goes down, or you need to spin up hundreds of new servers for recovery, you don’t do it by hand. You simply run an IaC script (using tools like Terraform, CloudFormation, Ansible, Puppet). This script automatically provisions the exact infrastructure you need, configured precisely as it should be, every single time. It’s repeatable, consistent, and fast.

    Lets look at an example when a major cloud region experiences an outage affecting multiple servers for a SaaS application. Instead of manually rebuilding, the operations team triggers a pre-defined Terraform script. Within minutes, new virtual machines, network configurations, and load balancers are spun up in a different, healthy region, exactly replicating the desired state.

    Ship It & Fix It Fast: CI/CD Pipelines for Recovery

    Continuous Integration/Continuous Delivery (CI/CD) pipelines aren’t just for deploying new features; they’re vital for automated recovery too. A robust CI/CD pipeline ensures that code changes (including bug fixes, security patches, or even recovery scripts) are automatically tested and deployed quickly and reliably.

    In the context of recovery, CI/CD pipelines offer several key advantages. They enable rapid rollbacks, allowing teams to quickly revert to a stable version if a new deployment introduces issues. They also facilitate fast fix deployment, where critical bugs discovered during an outage can be swiftly developed, tested, and deployed with minimal manual intervention, effectively reducing downtime. Moreover, advanced deployment strategies such as canary releases or blue-green deployments, which are often integrated within CI/CD pipelines, make it possible to roll out new versions incrementally or in parallel with existing ones. These strategies help in quickly isolating and resolving issues while minimizing the potential impact of failures.

    For example, if a software bug starts causing crashes on production servers. The engineering team pushes a fix to their CI/CD pipeline. The pipeline automatically runs tests, builds new container images, and then deploys them using a blue/green strategy, gradually shifting traffic to the fixed version. If any issues are detected during the shift, it can instantly revert to the old, stable version, minimizing customer impact.

    The Digital Safety Net: Backup and Restore Strategies

    Even with all the fancy redundancy and replication, sometimes you just need to hit the “undo” button on a larger scale. That’s where robust backup and restore strategies come in. This involves regularly copying your data (and sometimes your entire system state) to a separate, secure location, so you can restore it if something truly catastrophic happens (like accidental data deletion, ransomware attack, or a regional disaster).

    If a massive accidental deletion occurs on a production database, the automated backups, taken hourly and stored in a separate cloud region, allow the database to be restored to a point just before the deletion occurred, minimizing data loss and recovery time.

    The Smart Defenders: Resilience Patterns

    Building robustness directly into an application’s code and architecture often involves adopting specific design patterns that anticipate failure and respond gracefully. Circuit breakers, for example, act much like their electrical counterparts by “tripping” when a service begins to fail, temporarily blocking requests to prevent overload or cascading failures. Once the set cooldown time has passed, they “reset” to test if the service has recovered. This mechanism prevents retry storms that could otherwise overwhelm a recovering service.

    For instance, in an e-commerce application, if a third-party payment gateway starts returning errors, a circuit breaker can halt further requests and redirect users to alternative payment methods or display a “try again later” message, ensuring that the failing gateway isn’t continuously hammered.

    The following is an example of circuit breaker implementation using Istio. The outlierDetection implements automatic ejection of unhealthy hosts when failures exceed thresholds. This effectively acts as a circuit breaker, stopping traffic to failing instances.

    apiVersion: networking.istio.io/v1alpha3
    kind: DestinationRule
    metadata:
    name: reviews-cb
    namespace: default
    spec:
    host: reviews.default.svc.cluster.local
    trafficPolicy:
    connectionPool:
    tcp:
    maxConnections: 100 # Maximum concurrent TCP connections
    http:
    http1MaxPendingRequests: 50 # Max pending HTTP requests
    maxRequestsPerConnection: 10 # Max requests per connection (keep-alive limit)
    maxRetries: 3 # Max retry attempts per connection
    outlierDetection:
    consecutive5xxErrors: 5 # Trip circuit after 5 consecutive 5xx responses
    interval: 10s # Check interval for ejection
    baseEjectionTime: 30s # How long to eject a host
    maxEjectionPercent: 50 # Max % of hosts to eject

    Bulkhead is another powerful resilience strategy, which draw inspiration from ship compartments. Bulkheads isolate failures within a single component so they do not bring down the entire system. This is achieved by allocating dedicated resources—such as thread pools or container clusters—to each microservice or critical subsystem.

    In the above Istio configration there is another line in the config – connectionPool, which controls the maximum number of concurrent connections and queued requests. This is equivalent to the “bulkhead” concept, preventing one service from exhausting all resources.

    In practice, if your backend architecture separates user profiles, order processing, and product search into different microservices, a crash in the product search component won’t affect the availability of user profiles or order processing services, allowing the rest of the system to function normally.

    Additional patterns like rate limiting and retries with exponential backoff further enhance system resilience.

    Rate limiting controls the volume of incoming requests, protecting services from being overwhelmed by sudden spikes in traffic, whether malicious or legitimate. The following code is a sample rate limiting snipped from nginx (leaky bucket via limit_req):

    http {
    # shared zone 'api' with 10MB of state, 5 req/sec
    limit_req_zone $binary_remote_addr zone=api:10m rate=5r/s;

    server {
    location /api/ {
    limit_req zone=api burst=10 nodelay;
    proxy_pass http://backend;
    }
    }
    }

    Exponential backoff ensures that failed requests are retried gradually—waiting 1 second, then 2, then 4, and so forth—giving struggling services time to recover without being bombarded by immediate retries.

    For example, if an application attempts to connect to a temporarily unavailable database, exponential backoff provides breathing room for the database to restart and stabilize. Together, these cross-cutting patterns form the foundational operational pillars of automated system recovery, creating a self-healing ecosystem where resilience is woven into every layer of the infrastructure.

    Consider the following code snippet where retries with exponential backoff is implemented. I have not tested this code and this is just a quick implementation to explain the concept –

    import random
    import time

    def exponential_backoff_retry(fn, max_attempts=5, base=0.5, factor=2, max_delay=30):
    delay = base
    last_exc = None

    for attempt in range(1, max_attempts + 1):
    try:
    return fn()
    except RetryableError as e: # define/classify your retryable errors
    last_exc = e
    if attempt == max_attempts:
    break
    # full jitter
    sleep_for = random.uniform(0, min(delay, max_delay))
    time.sleep(sleep_for)
    delay = min(delay * factor, max_delay)

    raise last_exc

    In our next and final blog post, we’ll shift our focus to the bigger picture: different disaster recovery patterns and the crucial human element, how teams adopt, test, and foster a culture of resilience. Get ready for the grand finale!