Ajitabh Pandey's Soul & Syntax

Exploring systems, souls, and stories – one post at a time

Tag: Monitoring

  • The Silent Sentinels: Tools and Tactics for Automated Recovery

    We’ve journeyed through the foundational principles of automated recovery, celebrated the lightning-fast resilience of stateless champions, and navigated the treacherous waters of stateful data dilemmas. Now, it’s time to pull back the curtain on the silent sentinels, the tools, tactics, and operational practices that knit all these recovery mechanisms together. These are the unsung heroes behind the “unseen heroes” if you will, constantly working behind the scenes to ensure your digital world remains upright.

    Think of it like building a super-secure, self-repairing fortress. You’ve got your strong walls and self-cleaning rooms, but you also need surveillance cameras, automated construction robots, emergency repair kits, and smart defense systems. That’s what these cross-cutting components are to automated recovery.

    The All-Seeing Eyes: Monitoring and Alerting

    You can’t fix what you don’t know is broken, right? Monitoring is literally the eyes and ears of your automated recovery system. It’s about continuously collecting data on your system’s health, performance, and resource utilization. Are your servers feeling sluggish? Is a database getting overwhelmed? Are error rates suddenly spiking? Monitoring tools are constantly watching, watching, watching.

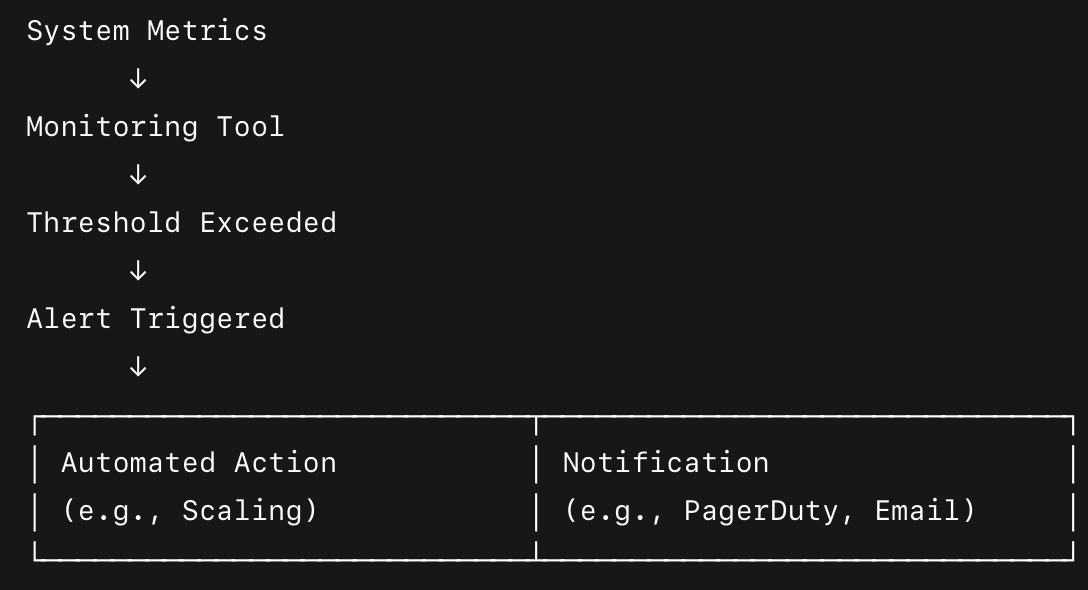
    But just watching isn’t enough. When something goes wrong, you need to know immediately. That’s where alerting comes in. It’s the alarm bell that rings when a critical threshold is crossed (e.g., CPU usage hits 90% for five minutes, or error rates jump by 50%). Alerts trigger automated responses, notify engineers, or both.

    For example, imagine an online retail platform. Monitoring detects that latency for checkout requests has suddenly quadrupled. An alert immediately fires, triggering an automated scaling script that brings up more checkout servers, and simultaneously pings the on-call team. This happens before customers even notice a significant slowdown.

    The following flowchart visually convey the constant vigilance of monitoring and the immediate impact of alerting in automated recovery.

    Building by Blueprint: Infrastructure as Code (IaC)

    Back in the days we used to set up server and configure networks manually. I still remember installing SCO Unix, Windows 95/98/NT/2000, RedHat/Slackware Linux manually using 5.25 inch DSDD or 3.5 inch floppy drives, which were later replaced by CDs as an installation medium. It was slow, error-prone, and definitely not “automated recovery” friendly. Enter Infrastructure as Code (IaC). This is the practice of managing and provisioning your infrastructure (servers, databases, networks, load balancers, etc.) using code and version control, just like you manage application code.

    If a data center goes down, or you need to spin up hundreds of new servers for recovery, you don’t do it by hand. You simply run an IaC script (using tools like Terraform, CloudFormation, Ansible, Puppet). This script automatically provisions the exact infrastructure you need, configured precisely as it should be, every single time. It’s repeatable, consistent, and fast.

    Lets look at an example when a major cloud region experiences an outage affecting multiple servers for a SaaS application. Instead of manually rebuilding, the operations team triggers a pre-defined Terraform script. Within minutes, new virtual machines, network configurations, and load balancers are spun up in a different, healthy region, exactly replicating the desired state.

    Ship It & Fix It Fast: CI/CD Pipelines for Recovery

    Continuous Integration/Continuous Delivery (CI/CD) pipelines aren’t just for deploying new features; they’re vital for automated recovery too. A robust CI/CD pipeline ensures that code changes (including bug fixes, security patches, or even recovery scripts) are automatically tested and deployed quickly and reliably.

    In the context of recovery, CI/CD pipelines offer several key advantages. They enable rapid rollbacks, allowing teams to quickly revert to a stable version if a new deployment introduces issues. They also facilitate fast fix deployment, where critical bugs discovered during an outage can be swiftly developed, tested, and deployed with minimal manual intervention, effectively reducing downtime. Moreover, advanced deployment strategies such as canary releases or blue-green deployments, which are often integrated within CI/CD pipelines, make it possible to roll out new versions incrementally or in parallel with existing ones. These strategies help in quickly isolating and resolving issues while minimizing the potential impact of failures.

    For example, if a software bug starts causing crashes on production servers. The engineering team pushes a fix to their CI/CD pipeline. The pipeline automatically runs tests, builds new container images, and then deploys them using a blue/green strategy, gradually shifting traffic to the fixed version. If any issues are detected during the shift, it can instantly revert to the old, stable version, minimizing customer impact.

    The Digital Safety Net: Backup and Restore Strategies

    Even with all the fancy redundancy and replication, sometimes you just need to hit the “undo” button on a larger scale. That’s where robust backup and restore strategies come in. This involves regularly copying your data (and sometimes your entire system state) to a separate, secure location, so you can restore it if something truly catastrophic happens (like accidental data deletion, ransomware attack, or a regional disaster).

    If a massive accidental deletion occurs on a production database, the automated backups, taken hourly and stored in a separate cloud region, allow the database to be restored to a point just before the deletion occurred, minimizing data loss and recovery time.

    The Smart Defenders: Resilience Patterns

    Building robustness directly into an application’s code and architecture often involves adopting specific design patterns that anticipate failure and respond gracefully. Circuit breakers, for example, act much like their electrical counterparts by “tripping” when a service begins to fail, temporarily blocking requests to prevent overload or cascading failures. Once the set cooldown time has passed, they “reset” to test if the service has recovered. This mechanism prevents retry storms that could otherwise overwhelm a recovering service.

    For instance, in an e-commerce application, if a third-party payment gateway starts returning errors, a circuit breaker can halt further requests and redirect users to alternative payment methods or display a “try again later” message, ensuring that the failing gateway isn’t continuously hammered.

    The following is an example of circuit breaker implementation using Istio. The outlierDetection implements automatic ejection of unhealthy hosts when failures exceed thresholds. This effectively acts as a circuit breaker, stopping traffic to failing instances.

    apiVersion: networking.istio.io/v1alpha3
    kind: DestinationRule
    metadata:
    name: reviews-cb
    namespace: default
    spec:
    host: reviews.default.svc.cluster.local
    trafficPolicy:
    connectionPool:
    tcp:
    maxConnections: 100 # Maximum concurrent TCP connections
    http:
    http1MaxPendingRequests: 50 # Max pending HTTP requests
    maxRequestsPerConnection: 10 # Max requests per connection (keep-alive limit)
    maxRetries: 3 # Max retry attempts per connection
    outlierDetection:
    consecutive5xxErrors: 5 # Trip circuit after 5 consecutive 5xx responses
    interval: 10s # Check interval for ejection
    baseEjectionTime: 30s # How long to eject a host
    maxEjectionPercent: 50 # Max % of hosts to eject

    Bulkhead is another powerful resilience strategy, which draw inspiration from ship compartments. Bulkheads isolate failures within a single component so they do not bring down the entire system. This is achieved by allocating dedicated resources—such as thread pools or container clusters—to each microservice or critical subsystem.

    In the above Istio configration there is another line in the config – connectionPool, which controls the maximum number of concurrent connections and queued requests. This is equivalent to the “bulkhead” concept, preventing one service from exhausting all resources.

    In practice, if your backend architecture separates user profiles, order processing, and product search into different microservices, a crash in the product search component won’t affect the availability of user profiles or order processing services, allowing the rest of the system to function normally.

    Additional patterns like rate limiting and retries with exponential backoff further enhance system resilience.

    Rate limiting controls the volume of incoming requests, protecting services from being overwhelmed by sudden spikes in traffic, whether malicious or legitimate. The following code is a sample rate limiting snipped from nginx (leaky bucket via limit_req):

    http {
    # shared zone 'api' with 10MB of state, 5 req/sec
    limit_req_zone $binary_remote_addr zone=api:10m rate=5r/s;

    server {
    location /api/ {
    limit_req zone=api burst=10 nodelay;
    proxy_pass http://backend;
    }
    }
    }

    Exponential backoff ensures that failed requests are retried gradually—waiting 1 second, then 2, then 4, and so forth—giving struggling services time to recover without being bombarded by immediate retries.

    For example, if an application attempts to connect to a temporarily unavailable database, exponential backoff provides breathing room for the database to restart and stabilize. Together, these cross-cutting patterns form the foundational operational pillars of automated system recovery, creating a self-healing ecosystem where resilience is woven into every layer of the infrastructure.

    Consider the following code snippet where retries with exponential backoff is implemented. I have not tested this code and this is just a quick implementation to explain the concept –

    import random
    import time

    def exponential_backoff_retry(fn, max_attempts=5, base=0.5, factor=2, max_delay=30):
    delay = base
    last_exc = None

    for attempt in range(1, max_attempts + 1):
    try:
    return fn()
    except RetryableError as e: # define/classify your retryable errors
    last_exc = e
    if attempt == max_attempts:
    break
    # full jitter
    sleep_for = random.uniform(0, min(delay, max_delay))
    time.sleep(sleep_for)
    delay = min(delay * factor, max_delay)

    raise last_exc

    In our next and final blog post, we’ll shift our focus to the bigger picture: different disaster recovery patterns and the crucial human element, how teams adopt, test, and foster a culture of resilience. Get ready for the grand finale!

  • Monitoring Lotus Notes/Domino Servers

    Very recently I was asked to setup Nagios to monitor the Lotus Notes/Domino Servers. There were some around 500 plus servers across the globe. It was an all Windows shop and the current monitoring was being done using GSX, HP Systems Insight Manager and IBM Director. The client wanted a comprehensive solution so that they have a single monitoring interface to look at and after an initial discussion they decided to go ahead with Nagios.

    This document looks at monitoring Lotus Notes/Domino servers using SNMP through Nagios. I have provided some of the required OIDs and their initial warning and critical threshold values in tabular format. There are many more interesting OIDs listed in the domino.mib file. Also I have attached the Nagios commands definition file and service definition files at the end of the document. In order to use certain checks, some plugins are required which can be downloaded from http://www.barbich.net/websvn/wsvn/nagios/nagios/plugins/check_lotus_state.pl.

    Note – I recently found that the required plugins are not available on the original site anymore, so I have made my copy available with this document. You can download the scripts from the link at the bottom of the document.

    To start with I asked the windows administrators to install the Lotus/Domino SNMP Agent on all servers and after that I got hold of a copy of domino.mib file which is located in C:\system32.

    Next I listed all the interesting parameters from the domino.mob file and started querying a set of test servers to find out if a value is being returned or not. Following is the OID list and what each OID means. Most of these checks are only valid in the Active node. This is important to know if the Domino servers are in a HA cluster (active-standby pair). If there is only one Domino Server then these checks will apply.

    Moinitoring Checks on Active Node

    Monitoring Checks on Active Node
    Nagios Service CheckOIDDescriptionThreshholds (w- warning, c-critical)
    dead-mailenterprises.334.72.1.1.4.1.0Number of dead (undeliverable) mail messagesw 80, c 100
    routing-failuresenterprises.334.72.1.1.4.3.0Total number of routing failures since the server startedw 100, c 150
    pending-routingenterprises.334.72.1.1.4.6.0Number of mail messages waiting to be routedw10, c 20
    pending-localenterprises.334.72.1.1.4.7.0Number of pending mail messages awaiting local deliveryw 10, c 20
    average-hopsenterprises.334.72.1.1.4.10.0Average number of server hops for mail deliveryw 10, c 15
    max-mail-delivery-timeenterprises.334.72.1.1.4.12.0Maximum time for mail delivery in secondsw 300, c@600
    router-unable-to-transferenterprises.334.72.1.1.4.19.0Number of mail messages the router was unable to transferw 80, c100
    mail-held-in-queueenterprises.334.72.1.1.4.21.0Number of mail messages in message queue on holdw 80, c 100
    mails-pendingenterprises.334.72.1.1.4.31.0Number of mail messages pendingw@80, c@100
    mailbox-dns-pendingenterprises.334.72.1.1.4.34.0Number of mail messages in MAIL.BOX waiting for DNSw 10, c 20
    databases-in-cacheenterprises.334.72.1.1.10.15.0The number of databases currently in the cache. Administrators should monitor this number to see whether it approaches the NSF_DBCACHE_MAXENTRIES setting. If it does, this indicates the cache is under pressure. If this situation occurs frequently, the administrator should increase the setting for NSF_DBCACHE_MAXENTRIESw 80, c 100
    database-cache-hitsenterprises.334.72.1.1.10.17.0The number of times an lnDBCacheInitialDbOpen is satisfied by finding a database in the cache. A high ‘hits-to-opens’ ratio indicates the database cache is working effectively, since most users are opening databases in the cache without having to wait for the usual time required by an initial (non-cache) open. If the ratio is low (in other words, more users are having to wait for databases not in the cache to open), the administrator can increase the NSF_DBCACHE_MAXENTRIESw, c
    database-cache-overcrowdingenterprises.334.72.1.1.10.21.0The number of times a database is not placed into the cache when it is closed because lnDBCacheCurrentEntries equals or exceeds lnDBCacheMaxEntries*1.5. This number should stay low. If it begins to rise, you should increase the NSF_DbCache_Maxentries settingsw 10, c 20
    replicator-statusenterprises.334.72.1.1.6.1.3.0Status of the Replicator task
    router-statusenterprises.334.72.1.1.6.1.4.0Status of the Router task
    replication-failedenterprises.334.72.1.1.5.4.0Number of replications that generated an error
    server-availability-indexenterprises.334.72.1.1.6.3.19.0Current percentage index of server’s availability. Value range is 0-100. Zero (0) indicates no available resources; a value of 100 indicates server completely available

    Interesting OIDs to plot for trend analysis

    Interesting OIDs to plot for Trend Analysis
    enterprises.334.72.1.1.4.2.0Number of messges received by router
    enterprises.334.72.1.1.4.4.0Total number of mail messages routed since the server started
    enterprises.334.72.1.1.4.5.0Number of messages router attempted to transfer
    enterprises.334.72.1.1.4.8.0Notes server’s mail domain
    enterprises.334.72.1.1.4.11.0Average size of mail messages delivered in bytes
    enterprises.334.72.1.1.4.13.0Maximum number of server hops for mail delivery
    enterprises.334.72.1.1.4.14.0Maximum size of mail delivered in bytes
    enterprises.334.72.1.1.4.15.0Minimum time for mail delivery in seconds
    enterprises.334.72.1.1.4.16.0Minimum number of server hops for mail delivery
    enterprises.334.72.1.1.4.17.0Minimum size of mail delivered in bytes
    enterprises.334.72.1.1.4.18.0Total mail transferred in kilobytes
    enterprises.334.72.1.1.4.20.0Count of actual mail items delivered (may be different from delivered which counts individual messages)
    enterprises.334.72.1.1.4.26.0Peak transfer rate
    enterprises.334.72.1.1.4.27.0Peak number of messages transferred
    enterprises.334.72.1.1.4.32.0Number of mail messages moved from MAIL.BOX via SMTP
    cache cmd hit rateenterprises.334.72.1.1.15.1.24.0
    cache db hit rateenterprises.334.72.1.1.15.1.26.0
    hourly access denialsenterprises.334.72.1.1.11.6.0
    req per 5 minenterprises.334.72.1.1.15.1.13.0
    unsuccesfull runenterprises.334.72.1.1.11.9.0

    Files and Scripts

  • Setting up SNMP

    SNMP is Simple Network Management Protocol. It allows the operational statistics of a computer to be stored in object identifiers (OIDs) which can then be remotely queried and changed.
    For any serious remote monitoring, SNMP is required. I generally prefer to monitor server performances remotely using Nagios and SNMP.
    This document describes the SNMP setup, which can then be used by any SNMP remote management software.
    As a security measure, one needs to know the passwords or community strings in order to query the OIDs. The read-only community strings allow the data to be queried only and the read-write community strings allows the data to be changed.
    I will be refering the setup on an Ubuntu server, while they should apply to any linux distribution.
    Install SNMP daemon by

    $ sudo apt-get install snmpd

    and then add the following lines on top of the cofiguration file – /etc/snmp/snmpd.conf as follows.

    $ sudo vi /etc/snmp/snmpd.conf
    # type of string   private/public  host-from-which-access-is-restricted
    rwcommunity        private         127.0.0.1
    rocommunity        public          127.0.0.1
    
    rwcommunity        ultraprivate    cms.unixclinic.net
    rocommunity        itsallyours     cms.unixclinic.net

    The first column is the type of community string, the second column is the community string itself and the third column (not mandatory) is the host restricted to use that community string.
    The first two lines specifies that only localhost (127.0.0.1) is allowed to query the SNMP daemon using the specified read-only and read-write community strings. The next two lines specifies that only the host cms.unixclinic.net is allowed to query the SNMP daemon using the specified read-only and read-write strings.

    If I remove the hostname (cms.unixclinic.net) then basically any host can query the snmp daemon if it knows the right community strings.

    After making these changes, give the snmp daemon a restart and then test it using snmpwalk program:

    $ sudo invoke-rc.d snmpd restart
    Restarting network management services: snmpd.
    $ snmpwalk -v1 -c public localhost system
    SNMPv2-MIB::sysDescr.0 = STRING: Linux cms.unixclinic.net 2.6.17-10-generic #2 SMP Tue Dec 5 21:16:35 UTC 2006 x86_64
    SNMPv2-MIB::sysObjectID.0 = OID: NET-SNMP-MIB::netSnmpAgentOIDs.10
    DISMAN-EVENT-MIB::sysUpTimeInstance = Timeticks: (1314) 0:00:13.14
    SNMPv2-MIB::sysContact.0 = STRING: Ajitabh Pandey <hostmaster (at) unixclinic (dot) net>
    SNMPv2-MIB::sysName.0 = STRING: cms.unixclinic.net
    .......
    .......

    As a result of snmpwalk, you should see the system details as reported by SNMP. The snmpwalk command executed above means, you are querying “localhost” for “system” MIB and have specified SNMP ver 1 protocol to be used and the community string is “public”. Now as you know that this community string is for read-only access and is restricted to queries from 127.0.0.1 IP address only, so this works fine.

    Further, if you now try to execute the following command over the network from host “cms.unixclinic.net” using the community string “itsallyours”, it should also work. But in mycase instead a timeout is received:

    $ snmpwalk -v1 -c itsallyours cms.unixclinic.net system
    Timeout: No Response from cms.unixclinic.net

    Just for clarification, the current host from which snmpwalk is being run is also cms.unixclinic.net.

    This should work on most distributions (RHEL 3, RHEL 4 and Debian Sarge it works like this), but on Ubuntu “Edgy Eft” 6.10 its not the case. This will fail. The reason being the defualt settings of SNMP. Following is the output of ps command from both an Edgy Eft machine and Sarge machine:

    Ubuntu $  ps -ef|grep snmp|grep -v "grep"
    snmp      5620     1  0 11:39 ?        00:00:00 /usr/sbin/snmpd -Lsd -Lf /dev/null -u snmp -I -smux -p /var/run/snmpd.pid 127.0.0.1
    
    Debian $ ps -ef|grep snmp|grep -v "grep"
    root      2777     1  0  2006 ?        00:46:35 /usr/sbin/snmpd -Lsd -Lf /dev/null -p /var/run/snmpd.pid

    If you see carefully, that Ubuntu 6.10 snmp daemon is by default restricted to 127.0.0.1. This means that it is only listening on localhost. To change that and make it listen on all interfaces we need to change the /etc/default/snmpd file:

    Change the following line

    $ sudo vi /etc/default/snmpd
    .....
    SNMPDOPTS='-Lsd -Lf /dev/null -u snmp -I -smux -p /var/run/snmpd.pid 127.0.0.1'
    .....

    to

    SNMPDOPTS='-Lsd -Lf /dev/null -u snmp -I -smux -p /var/run/snmpd.pid'

    and then restart SNMPD

    $ sudo invoke-rc.d snmpd restart